
Doing mental math has been a way to avoid boredom for years, in my case. I would dream up mental math games to stay awake in classes in school and college, and often play around with number pattterns in my head when I’m out driving or riding. It doesn’t make me the world’s best travel companion, I suppose, but on the flipside, I never get bored on long solo trips.
But even in extremely short trips, such as those between different floors of the same building, I can’t help but think about math. And I’ve always wondered why lifts (elevators, if you want to be all fancy) assume that the average body weight is 68 kilograms.
Try it, the next time you get into a lift anywhere in India. Take a look at the number of people the lift will mention as the upper limit in terms of capacity, and take a look at the maximum permissible weight. The second number divided by the first will always be 68.
Why?
This question has been asked (and answered) on Quora, but the answer isn’t very satisfactory. Nor is the link used within that answer very informative. It simply states, in the case of a tragic accident involving elevators that one should assume an average weight of 68 kg, and given this assumption, it goes on to state that the accident was because of excess weight.
But that, of course, still leaves our question unanswered – why should one assume that the average weight of a human being is 68 kg?
The internet is a wonderful thing, and its long tail is a sight to behold. A Google search took me to a website that seems to be – best as I can tell – for fans of elevators. Yes, really – and they had this interesting factoid:
In Europe Standard, every passengers are assigned to at least 75 kg by default[1]. However, the suggested people can carry by the elevators are related how many spaces can the elevator allocated. Which is the Available Car Area[2]. (sic)
https://elevation.fandom.com/wiki/Capacity
That first footnote takes you to a Facebook page (of all things), and even there you’ll need to use Google Translate to get at what the text (which is in Chinese) is saying. But that just turns out to be a Hong Kong manual of some sort that simply says the same thing again. And no matter whether it is 68 kgs or 75 kgs, there still seems to be no answer to the question: why?
Wikipedia has an entry on the issue, and here is a table from that entry:
| Region | Adult population (millions) | Average weight | Overweight population / total population | Source |
|---|---|---|---|---|
| Africa | 535 | 60.7 kg (133.8 lb) | 28.9% | [12] |
| Asia | 2,815 | 57.7 kg (127.2 lb) | 24.2% | [12] |
| Europe | 606 | 70.8 kg (156.1 lb) | 55.6% | [12] |
| Latin America and the Caribbean | 386 | 67.9 kg (149.7 lb) | 57.9% | [12] |
| North America | 263 | 80.7 kg (177.9 lb) | 73.9% | [12] |
| Oceania | 24 | 74.1 kg (163.4 lb) | 63.3% | [12] |
| World | 4,630 | 62.0 kg (136.7 lb) | 34.7% | [12] |
Note that the data is from 2005. Lots of interesting data points to ponder over in that table, not the least of which is the ratio of the overweight population to total population column – North America is at an eye-popping 74%! But the average weight, for Asia, was only at 57.7 kgs. Does that mean that we can get more people in lifts in India? Let me perfectly clear: I am not for even a single second suggesting that we carry out crazy experiments like these ourselves. But as a statistician and an economist, I cannot help but ask if there is slack in the system.
Before we move on to the next table from Wikipedia, a slight digression based on [12] in the last column of that table. That footnote refers to a paper titled “The weight of nations: an estimation of adult human biomass“, and it is quite a read in its own right. This paragraph in particular caught my eye:
The average BMI in USA in 2005 was 28.7. If all countries had the same age-sex BMI distribution as the USA, total human biomass would increase by 58 million tonnes, a 20% increase in global biomass and the equivalent of 935 million people of world average body mass in 2005. This increase in biomass would increase energy requirements by 261 kcal/day/adult, which is equivalent to the energy requirement of 473 million adults. Biomass due to obesity would increase by 434%.
Walpole SC, Prieto-Merino D, Edwards P, Cleland J, Stevens G, Roberts I. The weight of nations: an estimation of adult human biomass. BMC Public Health. 2012 Jun 18;12:439. doi: 10.1186/1471-2458-12-439. PMID: 22709383; PMCID: PMC3408371.
Back to the next table in the Wikipedia entry, however. Here is where it gets even more fascinating. This table claims that the average weight of Indians is 65 kgs – but that’s for men. Women, on the other hand, are at 55 kgs. The table is too large to paste over here, but you can click here.
So where do they get that number from? The table links to an out-of-date webpage, but a little searching around on that page takes you here.
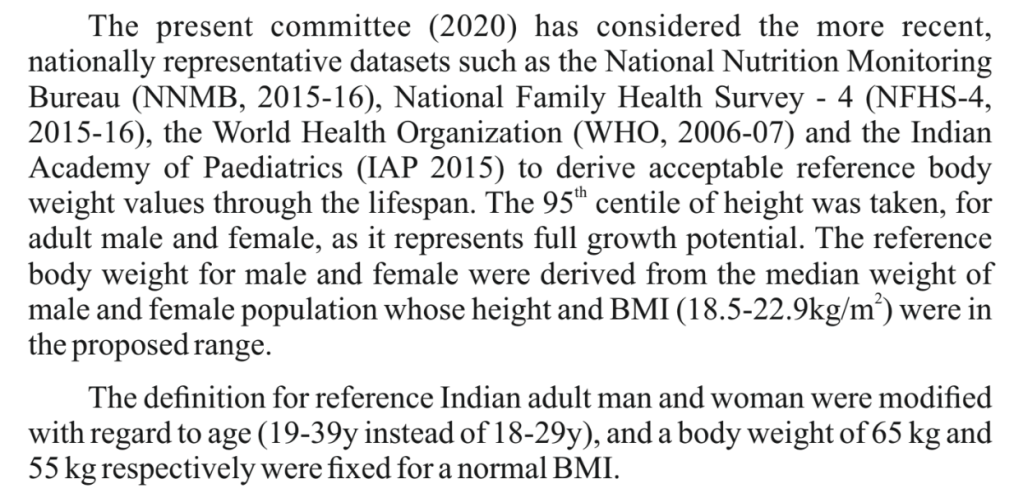
But does this mean that the average weight of Indian men is 65kgs, and that of women is 55 kgs? Or does this mean (which is what I think) that the reference Indian adult man and woman have a fixed body weight of 65 and 55 kgs respectively?
The NFHS factsheet simply tells us the percentage of people in India who are adult and overweight (30% in urban areas for both sexes, and about 20% in rural areas, in case you were wondering) – but we still dont know the average weight of Indians!
My best guess is that the number doesn’t come so much from the average weight of Indians, but rather from the nice round nature of the number itself. Now, you might not think 68 kilograms to be a round number, but try converting it into pounds, and see if my little theory makes any sense.
If anybody knows anything about this, and is willing to help, it would be much appreciated. But more importantly, to any student of statistics reading this, you can bring the subject magically alive by just looking around you, and by asking questions of a stubborn nature – such as the one that I just tried to answer here!
