External Resources about Supply and Demand

Where should you go online if you want to learn more about supply and demand?

Well, lots of places, really – but here’s a short list of the very best that is out there in making things simple and accessible.

A very good place to start (apart from the very beginning), is with the Principles of Economics section on Marginal Revolution University. Their very first video on the demand and supply section is here, and you can simply click upon the “Next Video” link to go through all of them.

The Wikipedia article is not bad, although a little wordy, in our opinion.

Here’s a simple post by a VC explaining how Uber uses these basic concepts to, well, run a business currently valued at $ 67 billion.

And of course, any and every text on economics will cover the topics we have spoken about here. Most of the links above, and all of the textbooks you might care to look at will be at a more complicated level than in our posts – but that’s the point. After you finish reading these, you should feel equipped to deal with the slightly more difficult ones.

Right, one topic from macroeconomics (the Solow Model) and one from microeconomics (the demand supply framework) down, and lots more to go. To keep things interesting, we’re now going to delve into an exciting area of economic research – behavioral economics. Starting with the next post!

Own Price, Cross Price and Income Elasticity

We studied elasticity in a previous post:

The percentage change in quantity demanded, given a percentage change in price.

In today’s post, we expand the definition of elasticity a little. That naturally makes it a little complicated, but it also enriches our understanding of it – a good bargain.

What if the price of a substitute changes? What if, that is, the price of Coke changes a little. By what percentage will the quantity demanded of Pepsi change? The measurement of such a thing is called cross price elasticity (substitute).

The percentage change in quantity demanded, given a percentage change in the price of a substitute.

The first definition above is therefore the definition of own price elasticity, while the second one is of cross price elasticity. Cross price elasticity, naturally, will be of twp types – that of complements, and that of substitutes.

There is yet a fourth type of elasticity, called income elasticity of demand. As you might imagine, it is

The percentage change in quantity demanded, given a percentage change in income.

Say your income in a particular month goes down by 10 percent. Is it reasonable to imagine that you will therefore cut back on your consumption of movies in a theatre, or dinners in restaurants? Unless you are a hardcore movie buff, or love eating out a lot, the answer would probably be yes. The income elasticity of demand for these goods is therefore high.

On the other hand, will you cut back your consumption of pills prescribed by your doctor? Almost definitely not, right? The income elasticity of demand for these goods is therefore low.

And that concludes our series on the basics of supply and demand!

Here’s a quick recap:

The demand (and supply) of a good depends upon:

  1.  it’s own price
  2. the price of complements and substitutes
  3. it’s own price elasticity
  4. the cross price elasticities
  5. the income elasticity
  6. changing tastes and preferences
  7. changing incomes

As you can no doubt see, thinking about demand is fairly complex – but it is, nonetheless, rewarding. In the next post, we’ll give you a list of resources for learning more about demand and supply (as we did for the Solow model), and then begin a new topic.

Tastes, Preferences and Income

Remember CD’s? They used to be the last word in convenient storage, and if you are of a particular age or higher “AVSEQ01.dat” will be a very evocative term indeed.

CD’s these days are available for around 15 rupees each, down from about 50 rupees a while ago, and maybe even higher. The law of demand that we have been learning about all this while suggests that the demand for CD’s should go up, since the price has come down.

Ah, but who uses CD’s these days? All the music you’d ever want to listen to and more is available on multiple streaming services. YouTube ensures that you have more video content to watch than is humanly possible, while services such as Netflix and Amazon Prime have made CD and DVD players ancient relics.

In other words, tastes and preferences of people have changed, and they will not want to buy CD’s, no matter the cost. So it’s not just the price of a good, nor that of complements and substitutes that matters – it also is whether or not you want to buy the good at all or not.

And to complicate matters even further, it’s not just tastes and preferences – it’s also income!

Remember dalda? Every Indian household used to use it in the 1980’s, but families today won’t go within sniffing distance of the stuff. That’s because, generally speaking, incomes have been rising, and households now have the money to make health-conscious choices – which means dalda is out, not matter the price.

And you could say the same thing for landlines, cassette recorders, cathode ray televisions, desktops, dumbphones – and that’s just from the world of electronics. As societies progress, they experience a rise in incomes and a change in tastes and preferences – and these things impact both the demand and supply of goods.

So, in a nutshell:

The price of a good, its elasticity, the price of its complements and substitutes, changes in incomes, tastes and preferences all impact the demand (and supply) of a particular good.

Next, we’ll take a look at cross price elasticity and income elasticity.

Complements and Substitutes

Two simple concepts, but really important ones.

When we speak about the demand of, and the supply of any particular thing, it is impacted by a variety of factors. One of these factors is the existence of substitutes and complements.

What are substitutes, and what are complements?

Say you walk into a store at the height of summer, thirsting for a nice, ice-cold cola. If you ask for a can of Coke, and upon being told that Coke isn’t available but Pepsi is, drink that can of Pepsi – well, then, you have “substituted” Pepsi for Coke. Goods that can act as a replacement for each other are substitutes.

These substitutes can be near/far substitutes. If no cola drink is available, and you drink nimbu sharbat instead, that is also a substitute. If you just have a glass of water instead of  a cola, well, that is also a substitute. Pepsi would be a close substitute, while water, arguably would be a not so close substitute.

Complements, on the other hand, are things that go well with, or must be used with, the good in question. Who ever heard of a flat screen TV without a set-top box? Of what use is a plate of pakoras in the monsoons without a hot cup of adrak wali chai? These become complements.

Now the reason these concepts are important is because they help us predict demand better. Say Coke sells its cans for 30 rupees, but Pepsi lowers prices to 20. Will the demand for Coke go up or down? Down, naturally, because a close substitute is available at a lower price.

When the price of a close substitute goes up, the demand for the good in question rises, and vice versa.

Generally speaking the closer the substitute, the more worried you should be about the price. Maruti Suzuki won’t lose sleep over its pricing of the Alto if Rolls Royce ups the prices on its models. Strictly speaking, these are substitutes – but not really. On the other hand, if Hyundai lowers the price on Eon (a very close substitute to the Alto), Maruti Suzuki will pay very, very close attention.

Also, the higher the number of susbtitutes, the lesser your ability to raise prices. Who ever heard of a chaiwalla selling tea at 20? It simply doesn’t make sense, because you can typically walk less than 100 meters to find a another chaiwalla selling an equally good cup of tea for the going rate.

And what about complements? Well, it’s easy to think through this. If the price of set-top boxes rises, the demand for flat-screen TV’s will go down. Think about it – you have to factor in not just the cost of the TV, but also the thing that makes the TV useful in the first place. So as a whole package, if the cost is going to go up, well, demand will go down.

When the price of a complement goes up, the demand for the good in question falls, and vice versa.

Complements and substitutes affect the demand for goods, and are also important concepts in the field of marketing.

Next up, we’ll take a look at changing tastes and preferences.

Examples of elasticity

Here’s a question for you: when was the last time you passed a petrol pump and saw a discount offer on fuel?

Unless you have a very vivid recollection of your dreams, the answer is always going to be: never.

And why am I able to say that so confidently? Because, in the lingo of the economist, petrol is an inelastic good. That is, as per our last post, the quantity demanded doesn’t decrease all that much, even for very large increases in price.

If society has to be able to move goods and people across long distances, one can’t yet escape the need to refuel vehicles. Mr. Musk is single-handedly trying to change the truth value of that statement, but as things stand, one can’t do without petrol. So even if prices were to be raised, demand wouldn’t change all that much. And which is why it doesn’t make sense to offer discounts on petrol either! Because, if you can sell high quantities without giving discounts – well then, why give discounts in the first place?

This is true for cigarettes too. Not matter what the price, people will buy. And which is why finance ministers in every budget feel very safe in raising the tax on cigarettes – because people will pay.

On the other hand, Myntra sells clothes people don’t especially need, and is one of a thousand sellers (online and offline) in the business of selling a bewildering variety of clothes. If Myntra wants people to buy from them, they’re going to have to offer those clothes at a discount. That’s elastic demand.

And in fact, that last point we made is crucial to understand about elasticity. If there are a number of alternatives available, the elasticity will be high. If there are a low number of alternatives available, the elasticity will be low.

So the trick, as an entrepreneur, is to build a product that people absolutely want to  -need to! – buy, but also build a product that has no real alternative. You may absolutely want a cup of chai in the evening, but there will be a dozen chaiwallahs in your neighbourhood. On the other hand, you may be the only seller selling neon pink umbrellas with prickly handles – there’s no real alternative to your product, sure – but people don’t seem to want to buy it.

Inelastic products hit that sweet spot that combine both of these features, and that allows the company responsible for that product to reap the profits. Apple is the easiest example around, but there are so many more examples around us. Perhaps the best way of understanding elasticity is to try and come up with some examples from the world around you. Give it a shot!

In the next post, we’ll take a look at two related concepts: complements, and substitutes.

Explaining Elasticity

Open any micro textbook, and this is the definition of elasticity of demand that you will find (more or less):

“The percentage change in quantity demanded, given a percentage change in price”

Here is what it means, in practice. Say you’re a shopkeeper selling plain black umbrellas. Let’s say you sell them for a hundred rupees each. At this price, every month, you are able to sell 100 of them.

One especially sleepy Tuesday afternoon, you think to yourself that it’s been a while since I hiked the price at which I sell these umbrellas, so let’s start selling ’em at 110 rupees tomorrow.

All right, so do you still expect to sell 100 umbrellas this month, now that the price is 110 instead of 100? Do you expect to sell more than 100, less than 100? The answer to this question is the elasticity of demand for plain black umbrellas in your shop. One would think it’s fair to assume that the demand will go down with an increase in price. By how much, though?

There’s been a 10 percent increase in price. Will there be a 10 percent decrease in demand? If so, then the elasticity of demand for black umbrellas is -1. Economists usually leave out the “minus” since that’s more or less a given. If the percentage change in quantity demanded is the same as the percentage change in price, we say that the good in question has unitary elasticity.

What if there is a higher than 10 percent change in quantity demanded given a percentage change in price? What if, say, the percentage change in quantity demanded is 20 percent – what if you now sell only 80 umbrellas? In that case 20/10=2 – the elasticity will be 2.

Here’s the math: 20 percent because (80-100)/100=-20 percent, and 10 percent because (110-100)/100=10 percent.

We call the demand for such goods elastic. That is, a slight change in price leads to large changes in demand.

Similarly, if there is a small fall in demand – say, you sell 99 umbrellas instead of 100, elasticity in that case would be 0.1 (try and work out the math yourself). And we would then call the demand for this good inelastic. That is, changes in price have little to no impact upon quantity demanded.

If you’re learning about elasticity for the first time, though, it might be best to not get caught up in the math right away, and think through the intuition:

If I increase the price of a good a little bit, will the change in quantity demanded be as much as the change in price, or less, or more?

The quantifiable response to that question is the measurement of elasticity. It’s what allows Apple to never give a discount on their latest iPhones, and it’s what keeps goods on Myntra on near permanent sales.

And we’ll be taking a look at some real life examples in the next blog post!


3 factors that impact demand and supply

The Gurugram story that we learnt about in the previous post was a fairly simple one. We spoke about how people on both sides of the divide (demand and supply) think about prices and therefore their decisions about how much to supply and how much to demand. Alas, if it were only that simple.

As it turns out, there are many, many other factors at play when it comes to thinking about demand and supply. In this post, we are going to list out these factors, and in the posts to follow, we’re going to speak about each one of them in turn.

First, the existence of things that may be substitutes, and things that may be complements to the thing being analyzed. For example, flats/apartments may be one thing, but what about bungalows? A bungalow is a substitute for an apartment. Will a change in the price of bungalows affect the demand for apartments? If so, how? Buying an apartment also means, presumably, hiring an interior decorator.  Will the rates being charged by an interior decorator impact the decision to buy a flat? This is the analysis of complementary goods and substitute goods – one part of the puzzle.

Second, a change in taste and preferences. For example, with a rise in incomes, people may not want to stay in apartments, but in bungalows. Conversely, if there is a fall in income, people may not want to stay in apartments, but in slums. These things also impact our analysis.

Third, how sensitive is demand to a change in price. Very large changes in prices may not impact the demand for cigarettes all that much (and any finance minister worth his salt will tell you this), while very small changes in price will change the demand for jewellery significantly.

Each of these are factors that impact significantly both the demand and supply of a good, as as we mentioned, in the three posts that follow, we will take a look at each one of them, beginning with the third factor listed above: elasticity.

It’s the process, stupid

Think about Gurgaon Gurugram.

There are apartments, or flats, available for sale in Gurugram. Hundreds, thousands of apartments. Some are in complexes that come with a swimming pool, gymnasium and the works. Others are plain vanilla, with maybe a security guard at the gate if you’re lucky.

And there are thousands, maybe hundreds of thousands of potential buyers. Some are millionaires, many times over, while others barely eke out a living, but want to buy a place of their own. The higher the price, the more flats will be up for sale in Gurugram – that’s supply. The lower the price, the more the people will be willing to buy flats in Gurugram – that’s demand.

But how will the price be decided at which the number of people willing to buy per year is exactly equal to the number of flats being made available for sale each year? It works something like this:

Builder A, B and C have made flats of approximately the same quality, in roughly the same neighbourhood, and at roughly the same price. They are all quoting a per square foot (per sq. ft.) rate of about 10,000 rupees. However, to their disappointment, they find out that nobody is willing to buy at this rate. Lots of potential buyers visit their sales office, but balk at the price and walk away. The occasional sale is completed, but things are way below target.

So next month, having waited long enough, builders A, B and C put up hoardings announcing a “never before rate, for a limited time period only”. Flats, they say, will be sold for the throwaway price of 8000 rupees per sq. ft., but only until the end of the month. They are gratified to see that demand picks up sharply.

Many more people visit their sales offices, and they sell all the flats on offer. But this leads to two problems. One, the builders realize that with so many people willing to buy at Rs. 8000, they could probably have sold at a higher rate. Second, having sold at Rs. 8000, they are left with lesser money to plough into future project. So next month, they raise rates to Rs. 9000.

And maybe they find that more people are willing to buy at Rs. 9000 than they were at Rs. 10,000 – but not quite as many as were willing to buy at Rs. 8000. And this process of adjustment continues, on and on, in a never ending dance between the buyer and the seller.

It is this market adjustment process that lies at the heart of economics, of which the demand and supply equilibrium diagram is only a static, fleeting representation. So one must analyze and understand the diagram, as indeed we will. But please do remember that the diagram is a very, very small part of the puzzle.

There are many other things to consider, and we shall look at them in the next post.

The heart of economics

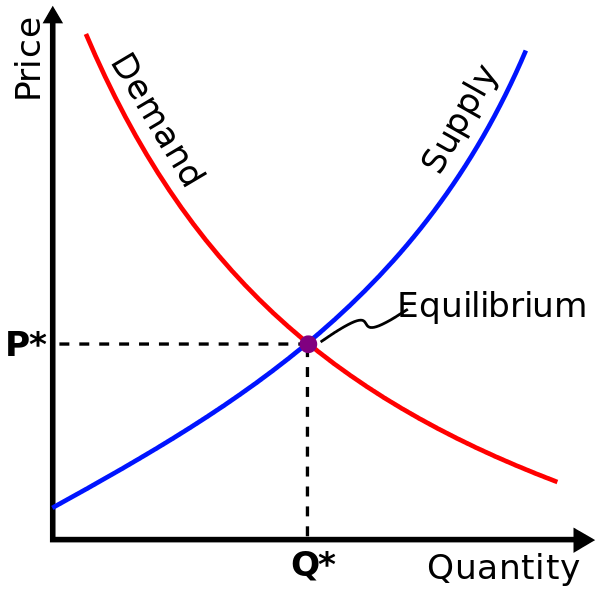
No other diagram is as important to understand economics as the image below. None, bar none.

Supply-demand-equilibrium.svg

No other diagram is as misunderstood either, and therein lies a tale.

Here’s a useful tip whenever you’re looking at a diagram, plot or chart for the first time. Don’t look at it.

The brain is looking for a story, a plot, a narrative with which to understand what is going on, and we take a look at the story that is being told to us. We might take a look at the content of the chart, the title of the chart – but very rarely do we take the time to take a look at the axes of the chart. Economists and statisticians learn this the hard way, by being fooled more often they should be – but you needn’t make that mistake. Remember, whenever you’re taking a look at a visualization for the first time, always take a look at the axes.

And in this case, the vertical axis shows you the price (they don’t mention this, but it is the per unit price), and the horizontal axis shows you the quantity demanded, measured in units. That is, if in this diagram you pick the intersection of the red line and the blue line to analyze, and assume that P* is 10 and Q* is 100…

… what that would mean is that the market is willing to demand 100 units of a good (say, standard size packets of Parle-G) when the price is 10 rupees per standard size packet of Parle-G. The reason we can say this is because that point of intersection lies on the red line, which is the demand curve.

Of course, since the point of intersection lies on blue curve as well, it also means that the market is willing to supply 100 units of standard size packets of Parle-G when the price is 10 rupees per standard size packet of Parle-G.

That is, we are in a happy instance of the suppliers in the market being willing to supply exactly the amount that consumers in the market are willing to buy – at that particular price of 10 rupees, per standard size packet of Parle-G. The amount that is being produced is exactly the amount that is being demanded, and we economists therefore call this the market clearing price.

We need to be aware of a couple of things that are often left unsaid. One, we really ought to be speaking about the quantity demanded and supplied per time unit. This could be per hour, per minute, per year – but it needs to be per something. It isn’t much use to say that markets clear, because how long they take to clear also matters.

Second, this equilibrium isn’t a magical things that simply happens – it is the outcome of a process that involves buyers and sellers transacting with each other repeatedly, over time. It is this process that economics studies. In other words, the diagram you are taking a look at is the outcome of a process – and it is the process that is the most interesting.

So interesting, in fact, that we’re going to be devoting an entire post to it.

Introducing the supply curve

Let’s say we’re wondering about setting up a chai tapri, you and I. It’s not the best, most original business idea in the world, but we should be able to earn some rate of return from our enterprise.

How much will be our rate of return? Well, difficult to say right now, but everyone will agree that it ultimately depends on the price at which we’re able to sell. So if we’re able to sell a cutting chai at, say 10 rupees, we are in business. But hey, if we realized that people are willing to buy at 20 rupees for a glass, even better. In that case, we would definitely want to get in the chai-making business.

And at 30 rupees, try and stop us from getting started, right? Except, at 30 rupees, it won’t be just us getting into the chai-making biz. Every Tom, Dick and Harry will be looking to set up a shop to sell chai.

Or, put another way, the supply of chai will go up, if the price per unit is going up. The higher the per unit price of a thing, the higher the supply of that thing. That’s the law of supply.

As with the law of demand, so also with the law of supply. It also depends on many other things – changing incomes, changing tastes and preferences, and the availability of other goods and services. Each of these things impacts the law of supply.

Things get really interesting, however, when you put the demand curve and the supply curve on the same diagram. This, the famous supply and demand framework, drives the very heart of microeconomic analysis, and that’s what we’re going to talk about next.