Are there easy, fun ways to combine what you learn in a classroom with easily available technology? Can these learnings be deployed for everybody to see and play around with, and can meaningful data emerge from such an exercise?
I’ve been asking myself this question for a while now, and have bee playing around with a couple of ideas in my head. Today’s post is about one such idea: it is me thinking out loud, and inviting you guys to throw suggestions, criticisms and potential problems my way. If anybody reading this wants to run with the idea, please – whatcha waiting for?
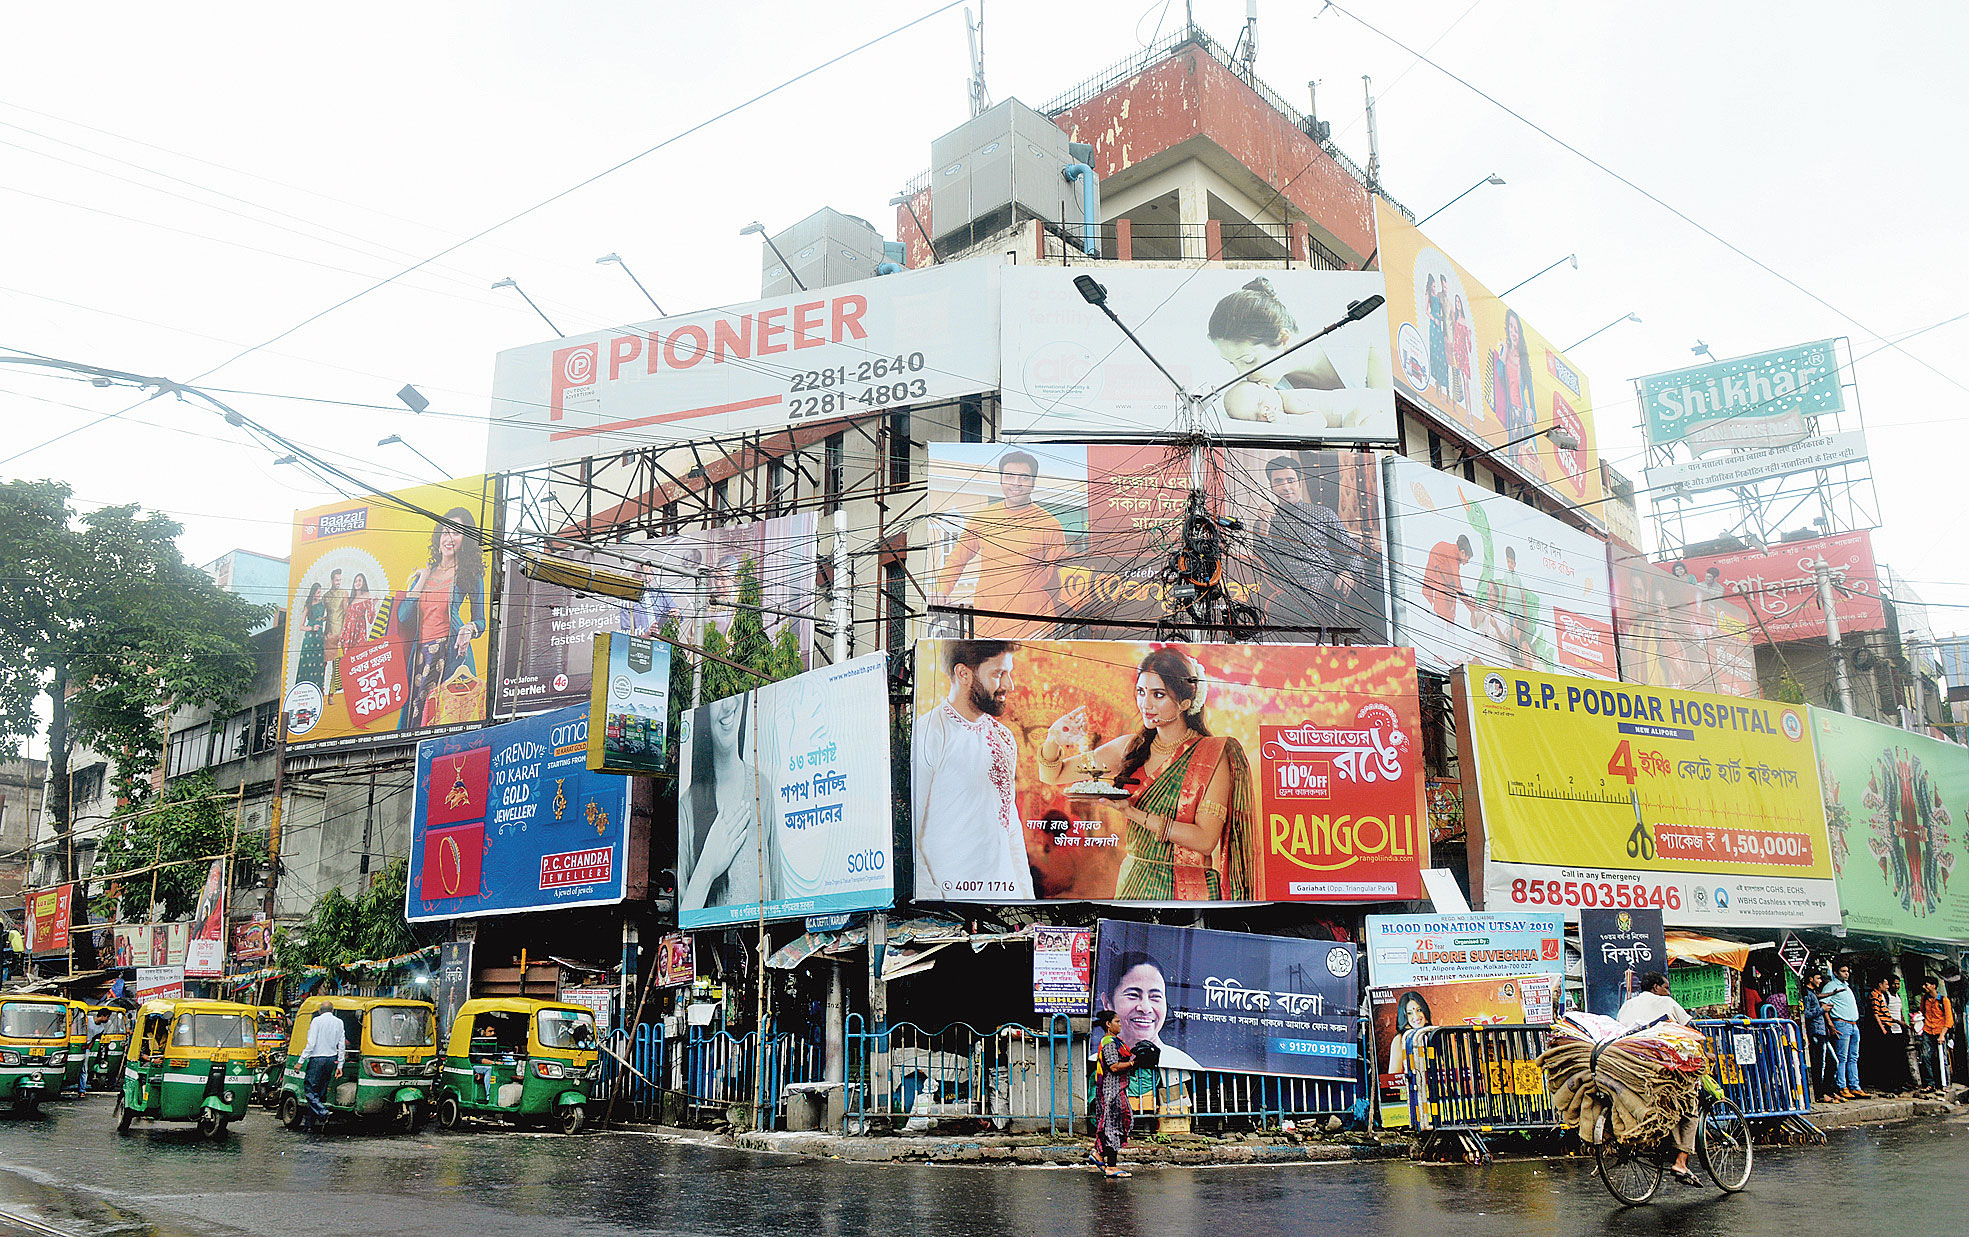
There isn’t an Indian road that isn’t riddled with hoardings. I mean, there may be the odd exception in each city, but it is safe to say that over 90% of all thoroughfares in all Indian cities have hoardings.
Original URL: https://www.telegraphindia.com/west-bengal/calcutta-learns-no-lesson-from-chennai-hoardings-boom/cid/1704998
What if two students got on a bike once a month, and took photographs of every single hoarding along a three kilometer stretch of road in their city? Same road, on the same date, every single month. What if this was done for many roads in may cities in India?
Almost all phones these days will allow you to geotag your photographs. Take the photos of these hoardings, and identify which ones have an advertisement on them, and which ones have those “CONTACT” signs, which effectively means that there is no advertisement on it for that month. Identify which ones have advertisements related to real estate, and which ones have non-real-estate advertisements.
You needn’t restrict yourself to only No advertisement/Advertisement for real estate/ Advertisement for non-real estate, of course. Make it as granular as you like!
And once you have the data, start to automate reports about it. The index could be a barometer for how well the local economy is doing, and how well it correlates with the state’s economy, or the Indian economy. You could build separate indices for all the sectors that you tag in your database. You could measure month-on-month changes, quarter-on-quarter changes, and you could build your own time-series data.
If enough students in enough cities get in on the exercise, you could do comparisons across cities, and across time.
This would, of course, naturally raise questions about which roads in which cities. How many roads in each city? Is MG Road in Pune city comparable to Baner Road in the same city? Why or why not? Are hoardings in Pune comparable to hoardings in Mumbai? What about Cochin? What about Bhopal? What about Lucknow?
One way to learn research methodology is to sit in a classroom and learn about it in the abstract. Any prof will tell you that a subject like RM can never be taught in the abstract. You need to get your hands dirty, you need to ask yourself these questions – that is when the subject comes alive.
Plus, this project has the advantages of teaching you:
- Team Building: there will be a lot of enthusiasm to begin with, but these things have a habit of petering out. It needs coordination, the ability to persistently motivate, and the anticipation that people will drop out over time. Do you need back-up teams? For which processes? Who decides?
- Systematic data collection: creating a template that all team members will follow is hard, at least the first time around. But without that template, documentation ain’t possible, and without documentation, serious research ain’t possible.
- Documentation: Everything will need to be documented, if you eventually want to make this work at scale. Who is working on which road, in which city, and for how long? How was the data captured? Do you have records of the journey on Google Maps? Are the photos correctly tagged? Are they of acceptable quality? What happens if a particular team visits not on the specified day, but three days later?
- Sampling: Why this city? Why this road? Is a small notice attached to a lamp-pole a hoarding or not? If yes, then do we take photos of every last little hoarding? If no, then were do we set the cut-off limit? On what basis? Do different cities have different definitions for hoardings? Do these definitions change over time?
- Dashboarding: How should the end-user (in this case, ideally the public) view this data? How do we make it informative, yet easy and entertaining at the same time?
- Google Map Overlays: How should we go about building one? Can it scale? Do we have to pay? Whom do we ask?
And that’s just me pecking away at a keyboard, entirely off the cuff. When we begin the work, there’ll be a thousand more questions a day.
But, on the bright side, you will get to learn about:
Hoarding regulations | Pricing | Sampling | Data collection |Team Building | Basic Statistics | Seasonality | Data Storage | Data Pulls | Geotagging | Map Overlays | Dashboarding | Marketing | (eventually) Funding
‘Tis but a thought, but I can’t help that it will be a better way to learn than just look at a computer screen, which is what the last year or so has been all about.
I want to try and gets started on this at my workplace, if possible. I’ll keep you posted about what (if anything) comes of this.
