Yesterday’s post was about taxation (or the lack of it) in the United States of America. Today’s post is about the composition of tax revenues in India (along with some questions to which I would love some answers).
So the Hindu came up with a very interesting analysis on the composition of India’s taxation revenues over the past couple of years:
In FY21, despite a stringent lockdown and a raging COVID-19 first wave, the gross tax revenue collected by the Centre increased over FY20. However, the increase was made possible by a sharp rise in contributions from union excise duties. This compensated for the sharp drop in the share of corporate tax collection. The shift in tax burden from the corporates to the masses has come at a time when the pandemic has led to many job losses and reduced income levels thereby pushing more people into poverty.
https://www.thehindu.com/data/data-centres-tax-revenues-grew-despite-stringent-lockdown-on-the-back-of-excise-duties/article34850754.ece
This is the first chart in their article:
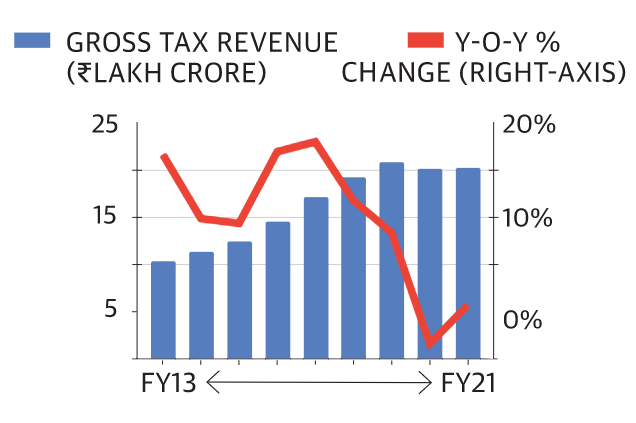
I tend to take chart design a little seriously, so before we proceed, a laundry list of ways in which I wish this chart was better:
- Source! What is the source of your data? As we will see later on in this blogpost, that really matters
- Dump the y-axes (or at least one of them) and label the series instead. I’d prefer to do this for both series
- This is especially important because you’ve got “base” numbers on the LHS y-axis and percentage change on the right, and visually, it is very non-intuitive. Especially because the RHS y-axis has zero at a different level when compared to the LHS.
- A horizontal line next to 0% on the RHS would help provide clarity.
- Any charting ninjas out there, please let me know where I’m wrong, and what you would do instead 🙂
Now, about the source of the data:
The article mentions that about “about 20.24 lakh crore was collected in FY21”. Since I don’t know which source was used, I’ve gone with the receipts statement from the Budget at a Glance section of the Union Budget website.

Gross tax revenue for 2020-21 (Revised Estimates) is Rs. 1900280. That’s… close enough, I suppose, to 20.24 lakh crores? Not really, if you ask me, but we’ll make do. By the way, to be clear, none of this is intended as a “hah, gotcha!” exercise. If there is a better data source that I should be using, please do let me know.
The excerpt above notes that gross tax revenue went up in FY 21 compared to FY 20. That’s not what this table shows, and I would love to learn more about which data source was used by The Hindu’s data team. That being said, their larger point is valid, and worth thinking about: in a year in which India’s GDP contracted, by around 7% or so, tax collections have been remarkably resilient. Going by the dataset I am using, they haven’t actually increased, but it is a close run thing, and that is remarkable.
[Professor Sabyasachi Kar was kind enough to point out a rather elementary error on my part: what matters is nominal GDP growth rate, not the real GDP growth rate. And nominal GDP contracted by around 3%, not 7% – that does explain a lot about the change in gross tax revenue we are seeing in this blogpost. Thank you, Professor 🙂 ]
Which means, of course, that we should be taking a look at which specific line items are responsible for this increase. And even a cursory glance at the table tells us that the impressive performance is almost single-handedly due to excise taxes. They’ve gone up from a base of Rs. 240615 crores in 2019-2020 to Rs. 361000 crores in 2020-21. That’s some growth!
If you are a student of the Indian economy, you might want to read this article, an excerpt from which is below:
The interesting thing is that the excise duty earned from the petroleum sector has jumped from Rs 99,068 crore in 2014-15 to Rs 2.23 lakh crore in 2019-20. The government has become addicted to easy revenue from taxing petrol and diesel. This year its earnings will be even higher than in 2019-20.
https://vivekkaul.com/2021/02/22/why-the-price-of-petrol-is-racing-towards-rs-100-per-litre/
As a student, never take numbers you read in an article as given. Not, to be clear, because you don’t trust the author, but because you should always go to the source of the data. Here’s one potential answer:
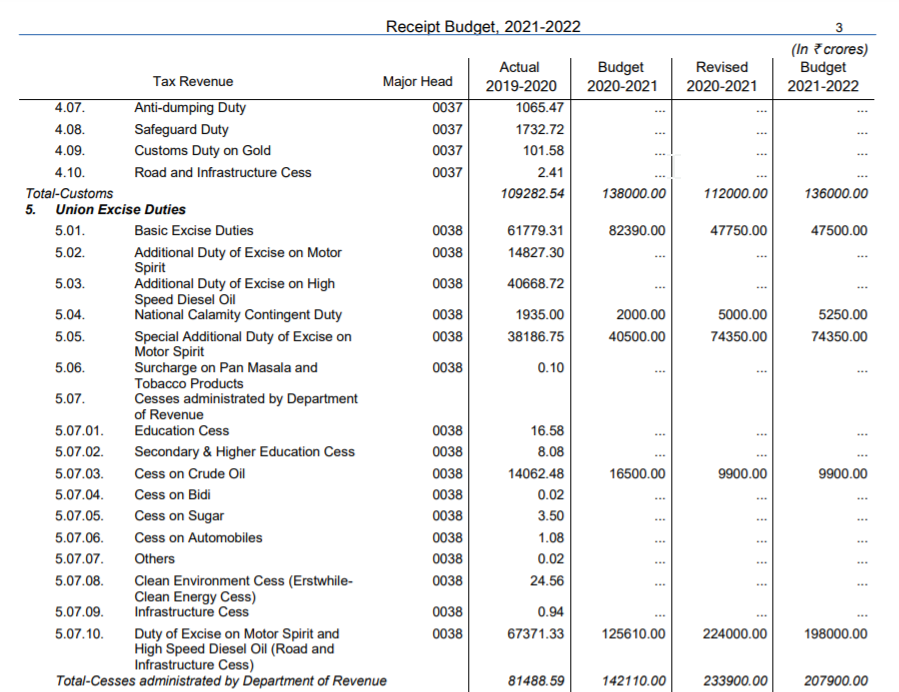
I personally want to learn more about 5.02, 5.03, 5.05, 5.07.10 and the “total” row. That’d be a great masterclass, if you ask me
The bottomline: it is a great time to be a student of the Indian economy. All of what your textbooks tell you, both in terms of theory and in terms of data, is being stress-tested in ways that really test your knowledge of the Indian economy – so long as you look hard enough, and don’t stop asking the right questions.
So please: look, and ask. 🙂
