Everywhere But In The Statistics

That is, of course, part of a very famous quote by Robert Solow:

You can see the computer age everywhere but in the productivity statistics

http://www.standupeconomist.com/pdf/misc/solow-computer-productivity.pdf

And in a recent newsletter, Paul Krugman agrees:

…have the past few decades generally vindicated visionaries who asserted that information technology would change everything? Or have they vindicated techno-skeptics like the economist Robert Gordon, who argued in a 2016 book that the innovations of the late 20th and early 21st century were far less fundamental than those between 1870 and 1940?
Well, by the numbers, the skeptics have won the argument, hands down.

https://www.nytimes.com/2023/04/04/opinion/internet-economy.html

Paul Krugman goes on to show this chart:

https://www.nytimes.com/2023/04/04/opinion/internet-economy.html

I’ll tell you how to read this chart, but back up for a moment and learn about total factor productivity first:

Total Factor Productivity (TFP) is a measure of how much output an economy can produce using the same amount of inputs, like labor and capital.
In simpler terms, TFP is like a measure of how smartly an economy is using its resources to make things. It tells us how efficiently a country is using its workers, machines, and materials to create products and services.
TFP is important because it can help explain why some countries are richer than others. When a country can produce more with the same amount of inputs, it can grow faster and become richer over time.
Measuring TFP is tricky because it’s hard to tell how much of a country’s output is due to factors like capital and labor, and how much is due to other things like technology and innovation. To measure TFP, economists use complex models that take into account all the different factors that could be affecting a country’s productivity.
In the context of development economics and growth theory, TFP matters because it can help explain why some countries are able to grow faster and become richer than others. Countries that are able to improve their TFP can create more goods and services with the same amount of resources, which can lead to faster economic growth and higher living standards for their citizens.
To improve TFP, countries can invest in education and research, create better infrastructure, and implement policies that encourage innovation and entrepreneurship. By doing so, they can create a more productive and efficient economy that can grow and thrive over time.

chat.openai.com

So here’s the question to ask: did the advent of the internet allow us, as an economy, to get smarter at using our resources to make things? Paul Krugman’s chart answer this question by showing how TFP growth changed over the next twenty five years from each given date on the x-axis. So if in 1948, TFP growth was just below 2, what that means is that TFP growth over the period 1948-1973 was just below 2. So did TFP growth go up in a twenty-five year period following 1996? The chart clearly says no, it didn’t, and Paul Krugman says “Ha!“:

See the great productivity boom that followed the rise of the internet? Neither do I.

https://www.nytimes.com/2023/04/04/opinion/internet-economy.html

Here’s the paragraph that really stuck out for me, though, from Paul Krugman’s column:

For the fact is that while moving information around is important, we’re still living in a material world: Most of what we consume is physical stuff or in-person services, which haven’t been drastically affected by the internet.

https://www.nytimes.com/2023/04/04/opinion/internet-economy.html

Huh. Let’s try to think this through:

  1. Use your own example, as I am about to do below.
  2. Do you use online services, even when it comes to consuming physical stuff or in-person services? In my case, Amazon is where I buy most of my physical stuff from, or from Amazon’s competitors. But they all have an online presence, and that is my preferred mode of shopping.
  3. I much prefer to have my food delivered home via Zomato or its competitors. My consumption of music is via online streaming services, my consumption of video is via YouTube or via OTT, I don’t even have a cable connection at home. My consumption (and creation) of the written word is almost entirely online (blogs, Kindle, Twitter, newsletters in my inbox). A fair few chunk of my classes at various colleges are online every now and then.
  4. Calling a plumber home, or an electrician, is via Urban Company, or one of its competitors. Booking flight/train tickets, booking movie tickets, paying my daughter’s school fees, transacting with my bank – I can go on, but it’s mostly online.
  5. Software has eaten, I would say, most of my world.
  6. But I should ask if I am falling prey to confirmation bias. What is decidedly offline, for me, as a consumer?
  7. I should also be asking if I am truly representative of the average Punekar, let alone the average Maharashtrian, let alone the average Indian, and still lesser an average citizen of the world.

I would say this much: I’m fairly confident that the Internet has enabled more consumption of goods and services than was the case twenty-five years ago. As a sixteen year old in 1998, I can guarantee you that reading what Paul Krugman wrote a couple of days ago would have been a very hard thing to do! And I feel fairly safe in saying that at varying margins, this is true for a lot of people in Pune, in Maharashtra, in India, and indeed in the whole world. Those margins will likely be influenced by per capita income in each country, by whether you stay in a more (or less) urbanized part of the world, and by a whole host of other factors. But as a species, a lot of our consumption of even physical goods or in-person services has been impacted by the advent of the internet.

I’m very curious to hear from you, especially if you disagree. Please tell me what I’m missing out on!

But that makes Paul Krugman’s chart even more puzzling! I’m tempted to disagree with him based on what I’ve written above, but I’m not sure how to disagree with the chart.
What about you?


Measuring GDP is hard.

Paul Krugman’s post ends with a few cool references, and since it’s behind a paywall, I’m listing them over here:

First, a nice YouTube video on washing machines and the internet:

Second, a simple explainer on TFP.

Third, a lovely book by Robert Gordon which you absolutely must read.


Final point: how to get better at measuring GDP is (and will likely continue to be for a very long time) a fascinating problem, and I will definitely write more about it in future posts. But in the meantime, if you have any recommendations about what to read/listen/view, please do share!

Is The Indian Economy Slowing Down?

That is a bit of a misleading title, because the focus of this blogpost isn’t about answering the question. It is, rather, about how to go about answering this question.

If you are a student new to economics, and someone were to ask you the question that is the title of this blogpost, how would you go about answering this question?

  1. Note that GDP data comes with a lag of about two months. You really should be looking at more recent data. But that being said, a good place to begin will be by tracking India’s quarterly GDP growth for the past (say) twelve quarters or so. This is actually bad advice for this specific time period, because of the pandemic, but under usual circumstances, not a bad place to start.
  2. Take a look at electricity generation numbers for the country. Check if there has been an increase, and if so, by how much.
  3. Check the trends in GST collections.
  4. Check trends in freight movement.
  5. Take a look at the Index of Industrial Production data.
  6. Take a look at India’s foreign trade data. Note that I have not used the word trend for these two points. That’s not because trends aren’t important (they are!) but because I want to lament the fact that India – the country that makes software for literally the entire world – isn’t able to come up with better ways to represent its own government’s data. Why does this not improve?!
  7. Take a look at the “Quarterly Financials of Listed Companies” on the CMIE website. Take a look at the trends for Net Profits and the PAT margins. This is usually on the right hand side of the website, you’ll have to scroll down a bit.
  8. Use the same website to take a look at the employment data.
  9. Take a look at the inflation data.
  10. Take a look at the bank credit data.
  11. Finally, note that this list is by no means complete. Other economists might well have more indicators they would like to recommend, and please don’t hesitate to show this list to them, and ask what they might like to include.
  12. Then, and only then, should you start to read opinion pieces about how well/badly the Indian economy is doing. See if your assessment matches with what is written or being said by others. If it doesn’t, ask yourself why. Check if you should look at other data sources, or other opinion pieces.
  13. But as an economist, remember: data comes first.

Risks, Investment and the Government

I linked to a Scott Galloway post about this topic recently, and have other posts about this topic (see this review of The Entrepreneurial State, and a post on R&D spends in an Indian context).

And the reason for another post about this topic is a recent Ezra Klein column about a new initiative out of the United States called ARPA-H:

Shortly after winning the presidency, Biden persuaded Congress to fund an analogue focused on medical technology: ARPA-H. Why do we need an ARPA-H when the National Institutes of Health already exists? Because the N.I.H., for all its rigor and marvels, is widely considered too cautious. ARPA-H will — in a move some lament — be housed at the Institutes, but its explicit mandate is to take the kind of gambles that Darpa takes, and the N.I.H. sometimes lets go. Wegrzyn, Biden promised, is “going to bring the legendary Darpa attitude and culture and boldness and risk-taking to ARPA-H to fill a critical need.”

https://www.nytimes.com/2022/09/18/opinion/biden-invention-arpa-h.html

Please read the whole article, as always, but I wanted to use this post to talk about the three things that make up the title of today’s post: risks, investments and the government.

If you are a student of economics, how should you think about these three things, and why do they matter?

  1. Investment is necessary for an economy to grow. And investment depends on a whole host of factors, and for a variety of reasons, this investment isn’t always forthcoming at speeds which one would like. This is one way to think about macroeconomics as a field of study.
  2. Part of the reason the requisite level of investment isn’t forthcoming is because of risks. Not all investments bear fruit, and it is quite likely that some investments will fall by the wayside. If firms are risk-averse, they may choose to not invest.
  3. Risk aversion (whether on parts of firms or individuals) isn’t a constant. It keeps on changing, once again for a variety of reasons, and what makes this even more difficult is that the assessment of risk is a very subjective phenomenon. You can dress it up in the garb of statistics and models as much as you like, but you’d be wrong to assume that subjectivity can be eliminated entirely. Leave alone the difference between risk and uncertainty, and the discussions that follow from here on in. That’s a whole other topic!
  4. If private firms aren’t willing to make investments, or take risks, especially in the case of moonshot investments that other nations are making, governments might decide to step in and invest instead. Remember that there is no reason to assume that governments will get the judgment call of when to do so right. They are as prone to mistakes as they rest of us, and if you take into account incentive alignment, you might well be right in assuming that they are likely to do marginally worse.
  5. But remember always that all-important question: relative to what? That is, if the need to invest is pressing and urgent (strategic considerations, geopolitical considerations, the need to develop more rapidly than we are thus far), and if investment is not forthcoming from the private sector, it makes sense for government to step in and get things moving.
  6. When should government step in? How much should it fund? How should it recoup its investments, if at all? How long should it stick around? What are the metrics of success? What are the opportunity costs? How is continuity of such programs guaranteed across different political administrations?
    There are no easy answers to these questions, and controversies galore are guaranteed.
  7. But the bottomline (to me) is that investments are necessary, they are risky, and they aren’t always forthcoming from the private sector. And there is therefore a role for government.
  8. But an economist should also worry about whether government will get it right or not, and if not, for what reasons. And to focus on making suggestions to make the processes associated with this better. This is hard, it is politically fraught, and it will go wrong more often than not.
  9. But it is necessary, and often unavoidable.
  10. If you are new to economics, and are wondering how principles of economics are applicable in “real-life” problems, I guarantee you this – you can spend entire careers thinking about these issues. And no matter when you start, your timing couldn’t be better.

Imports and GDP: This Stuff Matters!

I’ve done an earlier version of this post, but have tried to simplify it even further in what follows.

Let’s go back and take a look at a concept that most of us are familiar with, but perhaps don’t know well enough (myself included!): GDP.

What is GDP?

That’s an easy question to answer, and one that every student of Econ101 more or less memorizes:

The final value of all goods and services produced in an economy in one accounting period.

Check out this definition from Wikipedia, this one from the OECD, this one from the IMF,  or run a search yourself – they’ll all be more or less the same.

Now, you can measure GDP in more than a couple of ways, but the version that most students of economics are definitely familiar with is the expenditure approach. It says that GDP is measured by tallying up the total expenditure used to buy final goods and services.

You might be familiar with this equation, for example:

GDP = Consumption + Investment + Government Spending + Exports – Imports

Or, to give this equation its abbreviated version:

GDP = C + I + G + X – M

Now, this is where things begin to get a little tricky.

This equation, and the way it is written out, leaves a lot of people under the impression that a country’s income will go up, if only we imported less as a country. 

And it is an understandable position to take! If we imagine that M has a value of, say, 100, then GDP goes down by 100. If M were to be zero instead, GDP would be higher by hundred in this alternate scenario.

But this is wrong! I’m going to use two different ways to show you why this is wrong.

Here’s the first one: go back to the definition of GDP, at the top of this piece. Now that you’ve read it, answer this question: where are imports produced? Are they produced in our country, or are they produced in another country?

And if they’re produced in another country, should they be included in our GDP?

The reason the equation says minus M is because we shouldn’t be counting it in GDP in the first place. Once we remove imports, we’re left with the very definition of GDP: goods and services produced in an economy in a given time period. 

Subtracting imports doesn’t make GDP higher. Adding it is completely wrong accounting.

All right, fine, you might grudgingly say. But then why is it in the equation at all in the first place?

Fair question! 

If you are an American, living in America, and you buy a smartphone manufactured in China, that would count as an import (M). 

But here’s the thing: it would also count as consumption ( C ). 

Think about it: if you are using the expenditure approach to measure GDP, your purchase of a Chinese manufactured smartphone is consumption, and it is also an import.

If the American government were to import binoculars manufactured in Israel, it would be government expenditure (G). But it would also be imports (M). You could make similar arguments for investment (I) as well, but you get the idea now.

So, a longer, but more accurate and understandable way of writing out the expenditure method of GDP is as follows (hat-tip to Noah Smith for this version):

GDP = Domestically produced consumption + Imported consumption + Domestically produced investment + Imported investment + Government spending on domestically produced stuff + Government spending on imported stuff + Exports – Imports

Now, some simple crossing out of terms…

Gross Domestic Product = Domestically produced consumption + Imported consumption + Domestically produced investment + Imported investment + Government spending on domestically produced stuff + Government spending on imported stuff + Exports – Imports

…leaves you with this:

Gross Domestic Product = Domestically produced  consumption + domestically produced investment + Government spending on domestically produced stuff + Exports

That first version, with all the crossed out terms, is how we should really be writing it out all the time, because that is what economists really mean. But we don’t do that, unfortunately, leaving folks with the entirely understandable impression that reducing imports makes us richer.

But hey, now you know! GDP, by definition, has nothing to do with imports, and the reason we subtract imports out is because we’re adding them in while counting consumption, investment and government expenditure.

TN Ninan on The Misery Index

More often than not, inflation and unemployment move in opposite directions. Why this should be so, and whether this actually is so, are questions that can get a lot of economists very hot under the collar very quickly! 

But every now and then, this relationship breaks down very quickly, and we’re then staring at a problem that economists refer to as stagflation. That, in effect, is when inflation is stubbornly high, but unemployment is also stubbornly high. TN Ninan, a columnist for the Business Standard, riffs on this and related concepts in an excellent recent column

In particular, he drags up an idea that most of us haven’t heard about lately, the misery index. Given what’s around us these days, though, you might want to construct such an index for the months to come! What is the misery index, you ask? Well, simply add up the rate of unemployment and the rate of inflation for any given economy! It’s a simple enough index to create, and you can learn a fair bit by taking a look at which countries are doing well (low on the misery index), and which countries are the unfortunate table-toppers. 

As the column points out, Turkey, Argentina and South Africa top these charts, and Brazil and Russia round off the current top five. But most major economies are inching up this particular chart, and this is something you want to keep an eye on in the days to come. Here is more information, if you’re interested in learning more about the misery index.

Now, as with ice-cream flavors, so also with indices such as these. You can add in different flavors and come up with many different variations. So it was only a matter of time before somebody thought of adding in interest rates to create a new version of the misery index. Imagine living in an economy with high inflation, high unemployment and high interest rates! And if you want a little-bit-of-everything-when-it-comes-to-macro index, well, throw in per capita growth rates too. Note that this last addition actually makes it rather less of a misery index, since high per capita growth is a good thing.

And finally, TN Ninan’s column also mentions another interesting, relatively recent idea that you might want to explore yourself: The Great Gatsby curve. Take a look at what it means, and reflect on how appropriate the name is.

Literature and economic theory – who’d have thunk it, eh?

What is a Doom Loop?

Is a global recession imminent?

Probably. Macroeconomic forecasting is the stupidest of sports, but it is looking quite likely, yes.

How will recession start, how will it play out, and how long will it last? I don’t have the faintest idea, and trust me, nobody knows for sure.

But certain channels of both cause and effect (and sometimes both at the same time, because macro is hard) can be readily identified. And one such channel in today’s day and age is that of a ‘doom loop’.

A country is at risk of a doom loop when a shock to one part of its economic system is amplified by its effect on another. In rich countries, central banks should have the power to halt such a vicious cycle by standing behind government debt, stabilising financial markets or cutting interest rates to support the economy. But in the euro zone, the ECB can only do this to a degree for individual countries.

https://www.economist.com/the-economist-explains/2022/06/22/what-is-the-doom-loop-in-the-euro-zone

I haven’t taught international macro for a while now, but when I used to, I would explain this to my students by calling it the Mamata Banerjee/Narendra Modi/Raj Thackeray problem. I hope your curiosity is piqued!

For an economic union of political entities to work, there are (very broadly speaking) four things that must be present:

  1. A monetary union (which the EU has)
  2. A fiscal union (this is the Mamata Banerjee angle, explained below)
  3. Capital mobility (Narendra Modi)
  4. Labor mobility (Raj Thackeray)

Now, bear in mind that my examples are from a while back. I am referring to Mamata Banerjee’s first stint as Chief Minister, and the version of Narendra Modi I have in mind is the Chief Minister of Gujarat.

But back when Mamata Banerjee became Chief Minister of Bengal for the first time, one of the first things she did was to ask the Centre for help given West Bengal’s precarious finances. The point is not about whether it was given or not (as far as this blogpost is concerned), the point is that states routinely ask for, and sometimes get, aid from the centre. This may be because of natural disasters, or man made ones, financial ones or otherwise. The point is that the central government has the ability to ‘help’ out states if necessary. It is, of course, more complicated than that, and a fiscal union also implies the ability to raise and share taxes, but the central point is the fact there is help available, if needed.

But the ability of the European Union to do so is severely constrained, because you will need a lot of good luck to convince, for example, German voters that their taxes might be used to help the Spanish economy in its time of need. And for somewhat similar reasons, you can make more or less the same argument for the inability of the European Central Bank to chip in when necessary.

Or consider Narendra Modi’s invitation to Ratan Tata, to have his Tata Nano factory be relocated from West Bengal to Sanand in Gujarat. That’s an example of capital mobility, and again, this is much easier to achieve within a country.

And finally, Raj Thackeray, and his opposition to workers from outside Maharashtra ‘taking’ jobs within the state – that is a great way to understand what (lack of) labor mobility means.


The point is that an economic union must necessarily have these four things in place for it to be a meaningful, stable and well-functioning European Union. The idea isn’t new, of course – Robert Mundell‘s idea has been around since the late 1950’s, and there have been others who have worked on related ideas. Also read Paul Krugman on the topic.

But the point is that if a crisis strikes the EU, they have a limited range of weaponry that they can deploy.

Please read the rest of the article to get a sense of how linkages between European governments and its banks, the banks and the broader economy, and the broader economy and the European governments can both cause and exacerbate a crisis.

And as usual, the concluding paragraph for your perusal:

The euro zone is at less risk from doom loops than it was ten years ago, thanks to reforms to the banking system, the ECB’s commitment to preserve the euro and some embryonic fiscal integration. But the danger has not disappeared. And reforms to the euro zone’s architecture that would further reduce the risk have stalled⁠—in part because in 2012 the ECB boldly stepped in, easing the pressure on governments to make difficult decisions. As the ECB once again intervenes, the prospects for deep euro-zone reform look increasingly remote.

https://www.economist.com/the-economist-explains/2022/06/22/what-is-the-doom-loop-in-the-euro-zone

Imports, Exports and GDP

“The key is to understand that imports are also included in consumption, investment, and government spending. The real GDP breakdown looks like this:

  • GDP = Domestically produced consumption + Imported consumption + Domestically produced investment + Imported investment + Government spending on domestically produced stuff + Government spending on imported stuff + Exports – Imports

So you can see that while imports are subtracted from GDP at the end of this equation, they’re also added to the earlier parts of the equation. In other words, imports are first added to GDP and then subtracted out again. So the total contribution of imports on GDP is zero.”

That is an excerpt from a lovely little write-up by Noah Smith on his Substack, and one that I’ll be using whenever I teach macro. It’s lovely for many reasons, but most of all for the reason that the bullet point goes a very long way towards making the point that a lot of folks miss: you don’t get rich by importing less.

When I say “you”, I mean the country in question – and this equation, written out this way, helps us understand why. If you’re a student of macro, and are under the impression that India will get richer if only we imported lesser, think about the definition of GDP:

Gross domestic product (GDP) is the total monetary or market value of all the finished goods and services produced within a country’s borders in a specific time period.

https://www.investopedia.com/terms/g/gdp.asp

If you think about it, how can imports possibly qualify as being produced within a country’s borders? As Noah says, the equation can also be written like this:

GDP = Domestically produced consumption + Domestically produced investment + Government spending on domestically produced stuff + Exports

https://noahpinion.substack.com/p/imports-do-not-subtract-from-gdp?s=r

Read the rest of Noah’s post, especially if you are a student of macroeconomics. It should help clear up a lot of basic, but important and often misunderstood ideas about GDP calculations.


https://www.economist.com/finance-and-economics/2022/05/13/russia-is-on-track-for-a-record-trade-surplus

Russia has stopped publishing detailed monthly trade statistics. But figures from its trading partners can be used to work out what is going on. They suggest that, as imports slide and exports hold up, Russia is running a record trade surplus.
On May 9th China reported that its goods exports to Russia fell by over a quarter in April, compared with a year earlier, while its imports from Russia rose by more than 56%. Germany reported a 62% monthly drop in exports to Russia in March, and its imports fell by 3%. Adding up such flows across eight of Russia’s biggest trading partners, we estimate that Russian imports have fallen by about 44% since the invasion of Ukraine, while its exports have risen by roughly 8%.

https://www.economist.com/finance-and-economics/2022/05/13/russia-is-on-track-for-a-record-trade-surplus

Think about the previous section, and try and answer this question: is Russia poorer or richer or unchanged because Russia isn’t importing as much, as measured by GDP and changes in GDP?

Well, Russia may be worse off, and Russians may be worse off. It’s leader?

As a result, analysts expect Russia’s trade surplus to hit record highs in the coming months. The iif reckons that in 2022 the current-account surplus, which includes trade and some financial flows, could come in at $250bn (15% of last year’s gdp), more than double the $120bn recorded in 2021. That sanctions have boosted Russia’s trade surplus, and thus helped finance the war, is disappointing, says Mr Vistesen. Ms Ribakova reckons that the efficacy of financial sanctions may have reached its limits. A decision to tighten trade sanctions must come next.
But such measures could take time to take effect. Even if the eu enacts its proposal to ban Russian oil, the embargo would be phased in so slowly that the bloc’s oil imports from Russia would fall by just 19% this year, says Liam Peach of Capital Economics, a consultancy. The full impact of these sanctions would be felt only at the start of 2023—by which point Mr Putin will have amassed billions to fund his war.

https://www.economist.com/finance-and-economics/2022/05/13/russia-is-on-track-for-a-record-trade-surplus (Emphasis added)

Macro is hard! But it also matters, especially at times such as these.

India and China’s GDP Components Over Time

This should go without saying, but ask yourself if you are able to recreate these charts given the data sources mentioned in the tweet. You needn’t use DataWrapper necessarily (although if you’re considering journalism or a related field, learning it will help) – but do see if you can create the chart!

A Review of Macroeconomics: An Introduction, by Alex M Thomas

I’m not a fan of recommending a particular textbook to my students in any course that I teach. I’m not a fan of textbooks in general, but that’s a story for another day.

The reason I am against the idea that you should read “a” textbook for a course is because I find the idea that you can learn a subject by reading just one book to be a deeply repugnant one. I’m happy to recommend ten, or more. And students should learn by dipping into all of them!


But if you were to put a gun to my head and tell me that I must absolutely recommend just one macro text for Indian students who are learning macro for the first time, A Review of Macroeconomics: An Introduction, by Alex M Thomas would be it.

Why? For the following reasons:

Rare is the textbook that begins with a disclaimer to the effect that the author did not want to write a textbook. Rarer still is the preface that goes on to say that other textbooks (and more besides!) should also be read. If you are an econ prof, you must have read multiple prefaces by now that dispense advice about how chapters such-to-such, followed by chapters these-to-those ought to be included in an introductory course, but on the other hand chapters extra-but-still-necessary only need be included in an intermediate course.

The preface to this book does no such thing. Read the whole book, it says, and read more besides.

But the second most important part of the preface, and the part that got me hooked to the whole book is that includes a reference to a novel. That in itself is, well, novel. Second, it is an Indian novel. Third, it is a novel that has nothing to do with macroeconomic theory. This is a book that teaches you that macroeconomic theory – that after all, is the job of a textbook – but it is also a book that teaches you what to do with that theory. It teaches you to apply that theory to get a handle on the society that you need to study, and it helps you understand that this society is so much more than the abstractions of economic theory. Use this book to appreciate life better, it seems to say. Or, in the language of us economists, Alex Thomas has written the book as a complement to everything else that you will read and learn about Indian society. Not as a substitute. That is a rare old achievement, and one well worth celebrating.

The most important part?

Finally, this book adopts a problem-setting approach rather than a problem-solving one, as is the case with most economics textbooks. To put it more clearly, this text helps you to identify, conceptualize and discipline a macroeconomic problem. Therefore, this book does not contain exercises in problem solving, but it contains discussions and questions that make you think about the nature of assumptions, the logic of the theory, the limits of the theory, the interface between theory and policy, a little about the gaps between theory and data, and occasionally, the nature of past and present economic thought.

Preface, pp xvi, Macroeconomics An Introduction

There are nine chapters in the book, and I hope Alex Thomas won’t mind me listing them out over here:

  1. What is economics?
  2. Conceptualising the macroeconomy
  3. Money and interest rates
  4. Output and employment levels
  5. Economic growth
  6. Why economic theory matters
  7. The policy objectives of full employment
  8. The policy objective of low inflation
  9. Towards good economics

Say you want to teach a course in macroeconomics to students who have not studied the subject before. Conceptually speaking, here are the questions I would want to answer as an instructor:

What are we studying here, exactly? What are we abstracting from all of reality and of those abstractions, which features matter more than the others? Why are we studying whatever it is that we’re studying? If we (students and the prof) agree on the answers to the first few questions, how do we go about defining and measuring “success”? Why put the word success in inverted quotes?

Chapter 1 | Chapters 2,3,4 | Chapters 5 and 6 | Chapters 7 and 8 | Chapter 9 is how I interpret the layout of the book, in line with the questions above. Personally, I would have wanted to put chapters 5 and 6 right after chapter 1, but after having read the book, I can understand why the book was structured the way it has been. In particular, the four sections of the sixth chapter can only become truly comprehensible after you’ve gone through chapters 2,3,4. If I were to be teaching a course on macro, I would still be tempted to jump from 1 to at least the spirit of chapters 5 and 6, but that’s just my personal preference at play. Growth matters, and helping students appreciate why growth matters can be hugely motivating.


This book deserves a separate section of the review dedicated exclusively to the richness of the text. I challenge you to find me another textbook, from anywhere in the world that can go from talking about Tony Aspromourgo’s chapter on Piero Sraffa on pp 100, to talking about a Telugu novella on pp 102 (Kesava Reddy’s Moogavani Pillanagrovi: Ballad of Ontillu, 2013) to talking about Shrilal Shukla’s Raag Darbari on pp 103! To be clear, the challenge isn’t finding another textbook that talks of these three sources specifically (I can guarantee you that there isn’t another one!), but one that manages to traverse such breadth. Breathtaking stuff, and I never imagined I would use that phrase while reviewing a macro text.

But it’s not just that one series of excerpts. Every chapter is liberally sprinkled with a list of reading recommendations that stand out for their sheer breadth. All of them have been listed out between pages 200-208 in the text, and just these eight pages alone are worth the price of admission. Well, these eight pages and the two that precede it. In those two pages, Alex Thomas lists out all the data sources that have been used in the case of each table from each chapter.

In particular, this book deserves to be praised for raising repeatedly issues of caste, gender and ecology at various points through the text. Growth, but at what cost? Land as a factor of production, sure, but rooted in which society, and with therefore what consequences?

Consider this excerpt from pp 128, for example:

A village economy cannot be understood as a simple departure from the competitive macroeconomy we have discussed thus far. It requires us to understand how village space is divided and demarcated (typically on the basis of caste). The spatial inequality present in a village economy is captured very well by Kota Neelima in her depiction of a poor and indebted farmer’s house in Death of a Moneylender (2016).

The very next paragraph touches upon aspects of religion and its linkages to labor mobility. As always reasonable people can and should argue about how much of an impact these aspects (and other aspects of Indian society) have on the cold austere ivory tower approach that most macroeconomic textbooks adopt. I think it is a very significant impact, and you may not – and that is, of course, absolutely fine. But we are debating the quantum of significance and relevance, not questioning its very existence – and that is very, very welcome indeed.

Indeed, this is a book that ends with an exhortation: if you take one thing away from this book, Alex Thomas seems to be saying, take away an appreciation for the pluralistic approach (pp 196):

If you are a student of economics, you will soon study “statistics for economists’ and ‘mathematics for economists’. In both these methods of economics, there exist multiple concepts, theories and approaches, just like in macroeconomics and microeconomics; pay attention to the fact that these ‘methods of economics themselves both originated and are used within a social context. Moreover, a pluralistic approach to economics by itself is not sufficient when employing economics in the service of public policy; it is important to keep in mind the collective wishes of people as Xaxa’s poem in Section 1.4 pointed out.
I end this book with the hope that you take pluralism as a friend, sometimes a difficult one, in your journey of learning.


The pluralistic approach isn’t just restricted to moving across (and beyond) the social sciences. Even within the domain of macroeconomic theory, Alex Thomas takes the time and trouble to make sure that all views about the macroeconomy are fairly represented. The fifth chapter in particular is notable for this, but that should be taken to be especial praise for that chapter, not a faint damning of the others!

What could have been done better? If this book is intended for people learning about macroeconomics for the first time, I think this books errs on the side of doing a little bit too much. Some sections might be a little bit too involved for a reader who still has to cultivate a taste for macroeconomic theory (and god knows it is very much an acquired taste). And some first time readers might also not appreciate some of the macroeconomic controversies and the role they have played in pushing the field further.

This should beg the obvious question: well, what, exactly, should be cut? Well, not cut exactly, but some of the more involved explanations can be turned into, say, accompanying YouTube explainers (about which more below).

There are also some notable names missing from an introductory text of macroeconomics, but I’m all but certain that this is a case of conscious choice rather than inadvertent omission.

A tip to the students reading this review: help Alex out by coming up with videos that will act as accompaniments to the text. That is, if you are doing the hard work of reading through the text and understanding it, help others by creating content that will act as a complement to the reading of the text. Many students should do this, and in many languages! As Alex says, embrace plurality, both in terms of approach and understanding, but also linguistically speaking.


My biggest problem with the book is a bit of a meta-problem, and I hope I turn out to be wrong in what I am about to say. The biggest requirement, I think, of this book is a teacher who will do it justice. I honestly do not think that this book can be read by a first-time student of macroeconomics without some sort of mentoring and guidance. To be clear, this is not about the book being difficult or inaccessible – I am of the opinion that macroeconomics just is that hard.

But if what I’m saying is correct, then the success of the book is as dependent on the guide/mentor/professor as it is upon both the book and the reader. And that brings me to my answer to whether or not I would recommend that you read this book. It is not, I think, for everybody. But that’s not a criticism of the book, or its contents or the author. It is an acknowledgment of just how hard macroeconomics really is. In fact, Alex Thomas himself says that a year of undergrad studies in economics is recommended before you tackle this book.

But hey, hopefully I turn out to be wrong! Hopefully you can and will read this book and understand it.

And if you are already a serious student of economics (whether formally enrolled in a university or otherwise), then I absolutely and unreservedly recommend this book to you. As a student of Indian macroeconomics, you simply couldn’t do better. Period.


P.S. Alex Thomas will be speaking about his book to the students from the Gokhale Institute on the 17th of September. I don’t think livestreaming is possible, alas, but we will be putting up the recording on our YouTube channel for sure. If you have questions you’d like to ask Alex Thomas, pass them along here in the comments. We’ll try to work them in!

Meanwhile, In India…

Yesterday’s post was about taxation (or the lack of it) in the United States of America. Today’s post is about the composition of tax revenues in India (along with some questions to which I would love some answers).

So the Hindu came up with a very interesting analysis on the composition of India’s taxation revenues over the past couple of years:

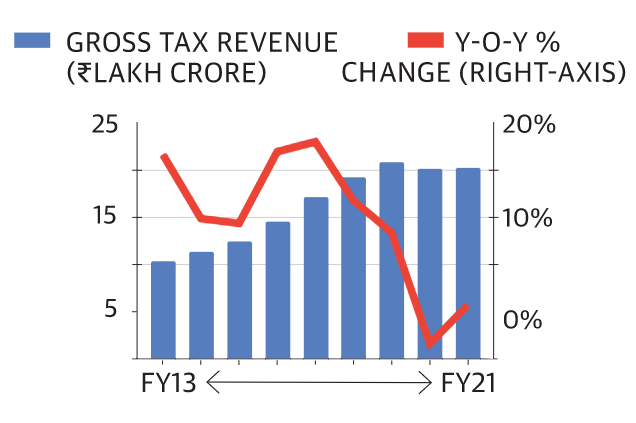
In FY21, despite a stringent lockdown and a raging COVID-19 first wave, the gross tax revenue collected by the Centre increased over FY20. However, the increase was made possible by a sharp rise in contributions from union excise duties. This compensated for the sharp drop in the share of corporate tax collection. The shift in tax burden from the corporates to the masses has come at a time when the pandemic has led to many job losses and reduced income levels thereby pushing more people into poverty.

https://www.thehindu.com/data/data-centres-tax-revenues-grew-despite-stringent-lockdown-on-the-back-of-excise-duties/article34850754.ece

This is the first chart in their article:

Source: https://www.thehindu.com/data/data-centres-tax-revenues-grew-despite-stringent-lockdown-on-the-back-of-excise-duties/article34850754.ece

I tend to take chart design a little seriously, so before we proceed, a laundry list of ways in which I wish this chart was better:

  • Source! What is the source of your data? As we will see later on in this blogpost, that really matters
  • Dump the y-axes (or at least one of them) and label the series instead. I’d prefer to do this for both series
  • This is especially important because you’ve got “base” numbers on the LHS y-axis and percentage change on the right, and visually, it is very non-intuitive. Especially because the RHS y-axis has zero at a different level when compared to the LHS.
  • A horizontal line next to 0% on the RHS would help provide clarity.
  • Any charting ninjas out there, please let me know where I’m wrong, and what you would do instead 🙂

Now, about the source of the data:

The article mentions that about “about 20.24 lakh crore was collected in FY21”. Since I don’t know which source was used, I’ve gone with the receipts statement from the Budget at a Glance section of the Union Budget website.

https://www.indiabudget.gov.in/doc/Budget_at_Glance/bag5.pdf

Gross tax revenue for 2020-21 (Revised Estimates) is Rs. 1900280. That’s… close enough, I suppose, to 20.24 lakh crores? Not really, if you ask me, but we’ll make do. By the way, to be clear, none of this is intended as a “hah, gotcha!” exercise. If there is a better data source that I should be using, please do let me know.

The excerpt above notes that gross tax revenue went up in FY 21 compared to FY 20. That’s not what this table shows, and I would love to learn more about which data source was used by The Hindu’s data team. That being said, their larger point is valid, and worth thinking about: in a year in which India’s GDP contracted, by around 7% or so, tax collections have been remarkably resilient. Going by the dataset I am using, they haven’t actually increased, but it is a close run thing, and that is remarkable.

[Professor Sabyasachi Kar was kind enough to point out a rather elementary error on my part: what matters is nominal GDP growth rate, not the real GDP growth rate. And nominal GDP contracted by around 3%, not 7% – that does explain a lot about the change in gross tax revenue we are seeing in this blogpost. Thank you, Professor 🙂 ]


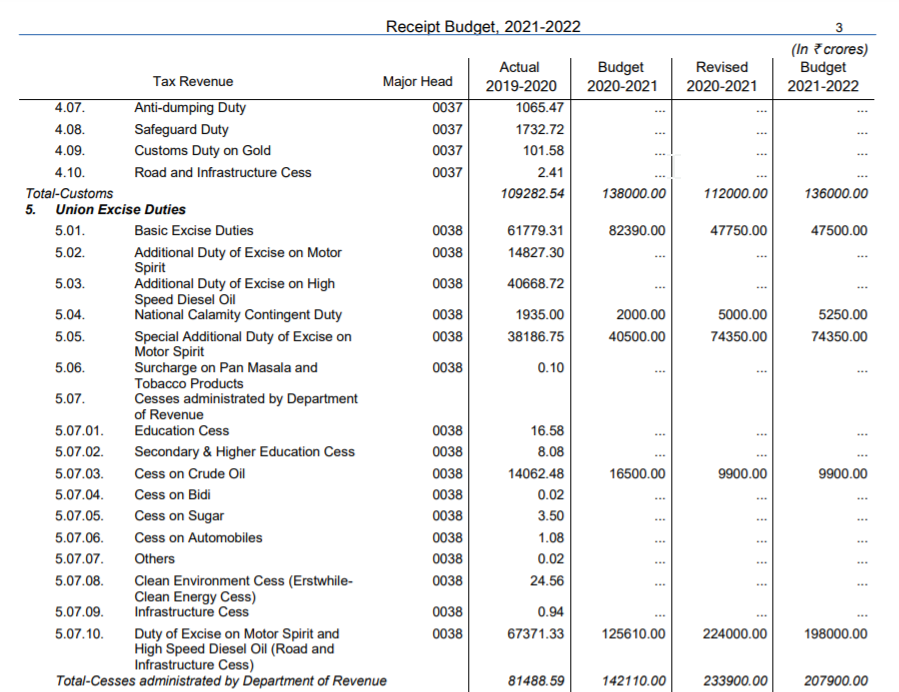
Which means, of course, that we should be taking a look at which specific line items are responsible for this increase. And even a cursory glance at the table tells us that the impressive performance is almost single-handedly due to excise taxes. They’ve gone up from a base of Rs. 240615 crores in 2019-2020 to Rs. 361000 crores in 2020-21. That’s some growth!

If you are a student of the Indian economy, you might want to read this article, an excerpt from which is below:

The interesting thing is that the excise duty earned from the petroleum sector has jumped from Rs 99,068 crore in 2014-15 to Rs 2.23 lakh crore in 2019-20. The government has become addicted to easy revenue from taxing petrol and diesel. This year its earnings will be even higher than in 2019-20.

https://vivekkaul.com/2021/02/22/why-the-price-of-petrol-is-racing-towards-rs-100-per-litre/

As a student, never take numbers you read in an article as given. Not, to be clear, because you don’t trust the author, but because you should always go to the source of the data. Here’s one potential answer:

Source: https://www.indiabudget.gov.in/receipt_budget.php

I personally want to learn more about 5.02, 5.03, 5.05, 5.07.10 and the “total” row. That’d be a great masterclass, if you ask me


The bottomline: it is a great time to be a student of the Indian economy. All of what your textbooks tell you, both in terms of theory and in terms of data, is being stress-tested in ways that really test your knowledge of the Indian economy – so long as you look hard enough, and don’t stop asking the right questions.

So please: look, and ask. 🙂