Paul Krugman responds (and also visit his Twitter profile to take a look at other threads by him on the issue).
But above all: if you think macro is tough, the good news is that you’re in excellent company!
Paul Krugman responds (and also visit his Twitter profile to take a look at other threads by him on the issue).
But above all: if you think macro is tough, the good news is that you’re in excellent company!
Here are links to the official sources:
The latest CPI report on the MOSPI website.
The WPI PDF report from the EA Industry website.
If you want a secondary source with better graphs, Trading Economics is a good option.
But that’s not what I want to talk about today. What I want to talk about is how you might think about inflation.
Greg Ip, the chief economics commentator for the Wall Street Journal, speaks about how he came to deeply understand the topic of inflation when his mother told him that his pocket money would be linked to the consumer price index in Canada, which is where he grew up.
It’s one thing to ask students in a class to visit a website that provides information about inflation, and it is quite another to have a young person’s pocket money be linked to it. Guess who is more likely to follow the website keenly, and guess who is likely to ask questions along the lines of “But why should the prices of zarda, kimam and surti impact my pocket money, huh?”
(Item code 2.1.01.3.1.07.0 and these together carry a weightage of 0.04869% in our CPI. Link here, and while you are at it, look up 6.1.04.1.1.03.0, and 6.1.04.2.2.01.0, and ask yourself some very interesting questions. There’s lots more to ponder about in that PDF, these are just to get you started!)
But there’s other things to ponder about where inflation is concerned too:
If it really wanted to get ahead of the inflation challenge, India’s central bank should have paid more attention to Surf Excel.
https://theprint.in/opinion/magic-prices-did-warn-of-indias-sticky-inflation-but-rbi-didnt-notice/957873/
The price of the laundry detergent went up by 20% in January. While that’s hardly news when most everyday things are becoming dearer everywhere, the interesting part was the retail price before the change: Rs 10 (13 US cents) for a bar.
Such tiny bars of detergent are targeted at less affluent consumers who are often unable to spend a rupee more without having to cut back on something else. To prevent these customers from downgrading to cheaper products, Unilever Plc’s India franchise relies on “magic price points” — such as Rs 5 or Rs 10 — that help buyers stay within their tight budgets.
Read the rest of the article, and if you are unfamiliar with pricing, especially in an Indian context, this will help you learn about the nuances of inflation. You may or may not agree with the article’s conclusions about spotting inflation in India, and that’s fine, as far as we’re concerned. But what we should be learning is an important lesson:
Inflation is about more than just changing prices.
And finally, give a listen to this podcast – and if you can’t be bothered to listen to the whole thing, the really interesting bit starts at around the 24th minute or so, where Tyler Cowen and James Altucher help you understand how you might build your own inflation index. We got a puppy home recently, and I can attest to some of the points made in that section!
Read the news and make sure you keep an eye on inflation, sure. But learn – especially when it comes to a topic like inflation – that textbooks and newspaper articles are only a start. These topics are way more complicated than that.
So from yesterday’s post, this is where you need to go to get the data about India’s agricultural exports. There may be more than one correct answer, of course, but the Excel file that I generated came from here. The DGCIS website also offered to give me the data, but after telling me that I would need to pay the princely amount of Rs. 169 for it. Why Rs. 169? They charge Rs. 1 for each row of data in MS Excel. Nope, I’m not making this up.

I can go on and on about the theme of working with data in India. Anybody who works with, or has worked with data published by the Indian government for the last twenty years can go on and on about this. We make it really difficult to access data easily in India, and that in the following ways:
To give you just one, already painfully familiar example: to download CPI data, should one go to the RBI website or the MOSPI website? If the MOSPI website (which is the correct answer), which MOSPI website? There have been two for a while now: this one, and this one.
And when you eventually do reach what may be the correct page, this is what you get:

For the record, I know you can get CPI data from the old MOSPI website. But the point I am trying to make here is this: surely we can get (and surely we deserve) better data portals? For a country with the kind of software talent that India possesses, surely this is not the best way to design a UI?
I’ve written about this before here on EFE, but every time I write a post about data in India, I get frustrated enough to write about it all over again.
Appoint an educational institute to be the nodal agency, and get them to work on a report about what needs to change, and why and how, for the DBIE website to become better than it is right now. That doesn’t mean (at all) a blind copy of FRED, awesome though FRED definitely is.
https://econforeverybodyblog.wordpress.com/2021/03/16/playing-around-with-data/
Is there anybody in India working on trying to figure out ways to get Indian data to be more easily accessible? On documenting what data sources are needed, and how to arrange for their capture, their storage, and to make it easy to retrieve it? And this across all three levels of government((state level data is a whole different problem. And data below that level of government is, well, let’s leave it be for the moment))? And not for private profit, but so that data is open to all?
If there is such a project, I would be most grateful if you could point me towards it. And if there isn’t one, why are those of us in Indian academia not working towards figuring out how to get this done? This is India, and this is 2021. Surely we can do a better job of making data more accessible to ourselves?
What is India’s current inflation rate?
Well, which India are you talking about? Are you talking about people like you and I, consumers? Or are you talking about big fat factories and how their costs are going up? Which kind of consumers? Those who live in the cities, or those who live in the villages? So complicated is our country, it turns out, that we don’t report just one inflation number. But the two that we tend to report and focus upon the most are the ones that I’ll be discussing here.
First: WPI, or the Wholesale Price Index. On the page that’ll open if you click on that link, click open the link for the WPI Press Release, and in the PDF, look out for the “annual rate of inflation”. At the time this post was written, inflation was at 0.79% for the month of May. In English, what that means is prices of commodities that are typically used in production were 0.79% more in May 2016 than they were in May 2015.
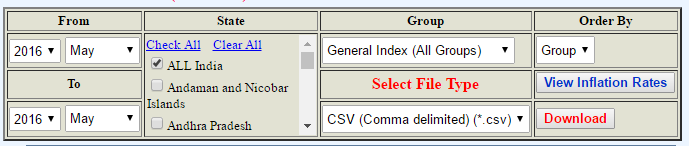
What about us consumers? Well in this case India reports the Consumer Price Index. On this website, on the left hand side, choose Annual Inflation Rates (Base: 2012, Current Series).
At the time of writing this post, information up to the month of May, 2016 was available. If you mirror on the website everything as shown above, you should get the lastest values for CPI in India.
So inflation in India for the month of May was at 5.76%. That is, prices for goods that consumers tend to purchase were 5.76% more in May 2016 than they were in May 2015. Urban consumers, as you can see, were slightly better off compared to rural consumers, in the sense that inflation was higher in the rural areas.
The idea was to show you where to go if you want to find out for yourself about how inflation in India is reported. We’d encourage you to play around with both of these websites, and try and make sense of the data, and get more familiar with it.
As we discussed in the previous post, though, always keep in mind that measuring inflation is a very complicated, and therefore very approximate task. Some things were way more expensive in May 2016 compared to May 2015 (think tomatoes) while some were actually a little cheaper (last year’s cellphones, for example). The reported number is an average.
And that’s inflation where India is concerned.