Sisyphus was lucky to be given the task of pushing that boulder. If they really wanted to be cruel, they could have asked Sisyphus to write about India’s agricultural policies.
Given that a number of state elections are coming up, one can understand the central government’s overdrive to tame food inflation. Obviously, it does not want inflation to be an issue in election campaigns. But how we tame food inflation, and at whose cost, is important to analyse for rational policy making.
Thus begins Ashok Gulati’s recent column on taming food inflation in India – and it becomes angrier from there on in. And with good reason.
We now have a minimum export price on basmati rice, of $,1200 per tonne. The typical export price for this commodity for the last five years or so has been not more than $1,000 per tonne, so let’s call this what it really is: a ban on exporting basmati rice.
So if there is supply, and the government artificially curtails demand, what do you think will happen to the price? Who will get this lower price?
Plus, demand has been curtailed not in India, but abroad (say, for example, in Dubai). Who will help meet this demand in Dubai? Farmers in Pakistan – so it would seem the Indian government has put in place policies to help Pakistani farmers. Go figure. Here’s how Ashok Gulati puts it: “Externally, it must be remembered that it takes years to develop export markets, and by putting such a high MEP, India is basically handing over our export markets to Pakistan, who is the only other main competitor of basmati rice. Is this a conscious policy decision?”
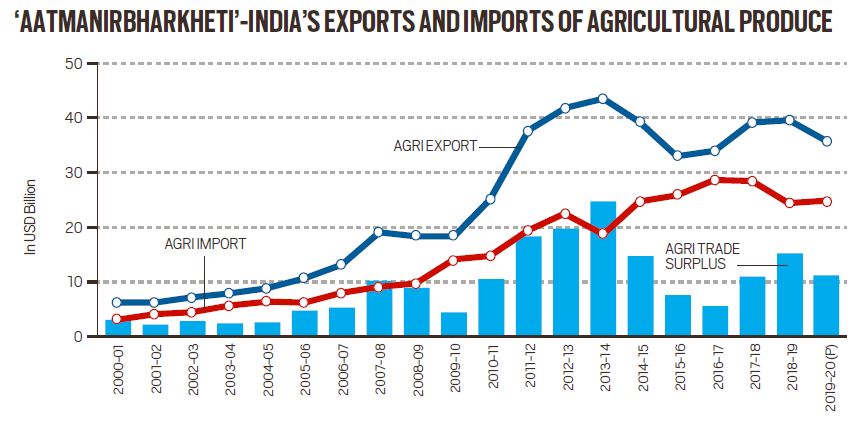
There’s this rather depressing statistic in the piece: “It may be noted that in 2013-14, the last year of the UPA government, India’s agri-exports touched $43.27 billion, up from $8.67 billion in 2004-05 when it took over power at the centre. This is almost a five-fold growth in 10 years. If the same momentum had been maintained during the 10 years of NDA rule, agri-exports should have touched $200 billion. But in reality, they may not touch even $50 billion this year (2023-24).”
Finally, Ashok Gulati also points out that our R&D expenditure on agriculture is 0.5% of our agri-GDP. And that, as he says, is simply too small a number, and needs immediate doubling, if not tripling.
Very few things in life are as frustrating as analyzing India’s agricultural policies in general. And within this set of policies, our muddled thinking about agricultural exports takes the cake.
When we designed the undergraduate program for economics at the Gokhale Institute, we were unable to fit in introductory courses on philosophy and anthropology. Among other courses, I should mention – it is not as if the absence of only these courses is my sole regret. But these two pinched more than the others, I’ll admit.
But one course that was included was sociology, and the reaction to it being a part of the syllabus has been mixed. “What is the use of studying sociology?” is a refrain I’ve heard for the past three years, and I wish it weren’t so. Why? Because not all answers to problems in the field of economics lie within the domain of economics.
I’ve long been convinced that “matters of culture” are central for understanding economic growth, but I’m also painfully aware these theories tend to lack rigor and even trying to define culture can waste people’s time for hours, with no satisfactory resolution.
Tyler Cowen is speaking here of culture, of course, not sociology, but the two are at least related – and in my opinion are practically the same.
But it is all very well to talk of the importance of sociology when it comes to studying economics. But what exactly does it mean?
TCA Srinivasa-Raghavan wonders, in a recent column in the Business Standard, about why India just can’t crack the export problem, no matter what we try:
The latest trade data once again show that India hasn’t been able to solve its export problem. Over the last 75 years, India has succeeded in solving many problems. Food, health, education, low GDP growth rates, and much else. But there is one problem it has been unable to solve — exports. At least a dozen committees over 60 years have tried to find solutions. The government itself has been straining hard to provide all kinds of incentives. All manner of policies have been tried. Nothing has worked. India, despite its amazing businessmen, remains a poorly performing exporting country. Even the success of IT exports is really labour export in a disembodied form.
And, he says, if India’s best and brightest economists cannot solve thhis problem, perhaps we should be looking to other domains. What about, he says, sociology?
For instance, is something about our business communities responsible for this failure? Is it the nature of our political and administrative structure? Or is it a combination of all these things?
What might be the problem with our business communities? Is jugaad a good thing or a bad thing? Why are we so dependent on, and happy with, the concept of jugaad? Do we take quality as seriously as our competitors? If not, why not? Did our competitors take quality seriously in the past? If not, what made them change?
Is our administrative structure a little too overbearing? If so, why? Is it because of misaligned incentives, as an economist would say, or is there something else “there”? If so, what? What makes our bureaucracy different from those in other countries, from a sociological/cultural viewpoint? Have we always been different?
Not all of these questions have answers exclusively within the domain of economics. It makes sense to study other domains, and ask how the study of those domains enriches your understanding of economic theory. It cuts both ways, of course. While studying those other domains, your study of economics will help you too!
Now, I don’t know, alas, what sociology has to do with India’s poor export growth – if anything at all. But it certainly is a fun question to think about, and is a great example of why studying sociology as a student of economics absolitely makes sense.
One final point. I’m often asked this question by students who are just about starting to learn economics: “What should I read to understand economics better?” They think I’m being deliberately difficult when I answer by saying “absolutely everything that you can read, and not just within the field of economics”.
I’m not, of course. I couldn’t possibly be more serious!
Say you’re a student, and you’ve just finished learning a fair bit about macroeconomics. You’ve read and not understood Keynes, you’ve read and think you’ve understood Friedman, and you don’t have the faintest idea what folks in macro have been up to since Robert Lucas.
OK, all that is fine, but how should a budding macroeconomist spend her summer this year?
You could do a lot worse than reading this article, and asking yourself some simple questions.
Such as, do I hear you say? Read on!
Google mobility, for instance, is down more than 40 per cent since the start of April and currently at levels seen a year ago, when the national lockdown was in effect. This dynamic is also visible in the cross-section: states that forced down mobility more strongly have, in general, also seen a larger drop in positivity rates.
What is Google Mobility? What does the data for India look like? How does this data correlate with statewise Covid-19 numbers? Can I create simple tables and charts in, say, Google Sheets that show a link between the two? And write up a blog about how I did it? Or maybe create YouTube tutorials that show how I did it?
That said, there’s growing evidence the impact will not be trivial even if not of the same scale as the first wave. By the middle of May, power demand was down 13 per cent and vehicle registrations were down 70 per cent compared to the start of the quarter, while e-way bills in the first half of the month were at 40 per cent of where they should be. A broader composite index would suggest activity is tracking a 6-7 per cent sequential decline this quarter and, while this is much shallower than the 25 per cent sequential contraction witnessed last year this time, the fact that it comes on the heels of the first shock, and can potentially trigger more hysteresis, remains a source of concern.
Household income uncertainty and precautionary savings can be expected to rise. Even before the second wave, households had signalled caution about future spending (manifested in the RBI Consumer Confidence Survey) likely reflecting both an income hit and a precautionary savings motive. This behaviour is consistent with labour market dynamics wherein the unemployment rate, once adjusted for reduced labour force participation, had increased meaningfully even before the second wave.
Private investment could also take time to pick up. Even before the second wave, utilisation rates were in the mid-60 per cent range, much lower than needed to jumpstart investment.
We have previously found a strong elasticity of India’s exports to global growth and, if that holds, this should drive a strong export rebound in India. Some of this is already visible in the data with manufacturing exports surging in recent months, and currently 18 per cent (in nominal dollar terms) above pre-pandemic levels.
If crude prices average close to $70 this fiscal year, as is expected, that would constitute a 50 per cent increase over last year and serve as a negative terms of trade shock that impinges on household purchasing power and firm margins — a process already underway.
EIA? Or something else? Should we take lagged data? If yes, with what lag? If no, why not? Where do we get information on firm margins? Bloomberg/Reuters? If yes, do we have access to a terminal? If no, whom do we ask for a favor?
When all is said and done, the completeness of an economy’s recovery from Covid-19 — and therefore the level of scarring — is assessed by comparing its post-Covid-19 path of the level of GDP with the path forecasted pre-Covid-19. If the aforementioned forecasts fructify, the level of quarterly GDP at the end of this year would be about almost 8 per cent below the level forecasted pre-pandemic. To be sure, India will not be the only emerging market to be below its pre-pandemic path. In fact, among the large economies, only the US and China will surpass it. But that said, an 8 per cent shortfall is meaningful.
What is the level of GDP, and how is it different from the growth rate of GDP? Which should one use, and how does the answer change depending on the context? Where do we get data on GDP of all countries at one time? Which one of these measures should we use for comparison, and why?
Macro is hard, and in many different ways. Understanding the theory is hard, but piecing together parts of the puzzle from disparate (and at lest in India, gloriously unfriendly) data sources is perhaps harder still. But if you want to “do” macro for a living, being familiar with the answers to these questions is table stakes.
That is, getting familiar with the answers to the questions I have asked here gets you the right to sit at the table. Playing the game better than the others once you’re in is a whole different story. And playing the game means using this data with your knowledge of theory to try and take a stab at the really important questions:
The question, therefore, is how should economic policy respond to this second shock? With fiscal and monetary policy already quite expansive, is there space to respond further? We assess policy options and tradeoffs in a companion piece tomorrow.
If you are confused about the difference between self-reliance and self-sufficiency, here is Swaminathan Aiyar in ET:
Self-reliance means making your own economy strong and strong does not mean giving it crutches like protectionism. That is the wrong way. Self-reliance means we say, look I am uncompetitive because I have relatively high cost of land or labour, high interest rates, high electricity rates and high freight rates. If I get all these down, I become more competitive. So if you are going in that direction, India will become strong and competitive. It will be able to trade in the world and we will not have a trade deficit problem. So the correct self-sufficiency means you strengthen your economy by making it more productive and more low cost. It does not mean you make it high cost by putting up tariffs. Therefore, protecting your least productive industry is the wrong direction.
The consensus among economists seems to be that we should be targeting self-reliance rather than self-sufficiency, but I would say that it is one thing to debate which to aim for without being explicit and crystal clear about what each of these terms mean.
You might want to read this Wikipedia article about the issue. Also, a request: if any of you have articles about the distinction, and any clear articulation about India’s policy stance in this regard, I would love to read it.
It is presumed that for a large country like India, with a population of 1.37 billion, much of the food has to be produced at home. We don’t want to be in a “ship to mouth” situation, as we were in the mid-1960s.
You might want to read about the following if you are unfamiliar with our “ship to mouth” situation: the sorry saga of the PL480 schemeand India (two separate links)
In the mid-1960s, if India had spent all its foreign currency reserves — the country had about $400 million — just on wheat imports, it could have imported about seven million tonnes (mt) of wheat. Today, India has foreign exchange reserves of more than $500 billion.
ibid
A question that is rarely asked – or at least, not asked as often as I would like it to be asked – is how did we get to a stage where we have more than $500 billion in reserves? We must have earned it, we obviously can’t print dollars. Which begs the question, how did we earn it? Two things: we depreciated our exchange rate, and we exported a helluva lot more post 1991. Self-sufficiency, in other words, tends to not work well!
Agri-exports have been subdued for the last six years or so, and we have yet to recover the peak of the ear 2013-2014. As Ashok Gulati mentions in his article, that year’s performance has not been bettered since.
What do our exports look like currently?
Marine products with $6.7 billion exports top the list, followed by rice at $6.4 billion (basmati at $4.6 billion and common rice at $2.0 billion), spices at $3.6 billion, buffalo meat at $3.2 billion, sugar at $2.0 billion, tea and coffee at $1.5 billion, fresh fruits and vegetables at $1.4 billion, and cotton at $1 billion.
ibid
Of which, Prof. Gulati picks rice and sugar for analysis – $8.4 billion worth of exports in total. Now, here is where all of what you may have learnt in microeconomics starts to make sense.
Think of a farm producing rice. The production function will tell you that you produce rice by combining inputs to produce output. What inputs? Labor, land – but also water and fertilisers. And the problem with fertilisers and water is that it is heavily, heavily subsidised in India.
Again, microecon 101: whatever isn’t priced tends to be overused, and that too indiscriminately. So what happens when you export more rice and more sugar every year? Well, to export more you have to produce more, and to produce more you have to use more inputs, and when you use inputs inefficiently, you end up exporting that input in larger quantities than is optimal.
Or, the simple version: we are exporting a lot of our water when we export sugar and rice. We’re also polluting our rivers and our soil, but that’s a story for another day.
But more importantly, it is leading to the virtual export of water as one kg of rice requires 3,500-5,000 litres of water for irrigation, and one kg of sugar consumes about 2,000 litres of water. So, in a sense, the two crops are leading to a faster depletion of groundwater in states such as Punjab, Haryana (due to rice) and Maharashtra (due to sugar). Thus, quite a bit of the “revealed comparative advantage” in rice and sugar is hidden in input subsidies. This leads to increased pressure on scarce water and a highly inefficient use of fertilisers.
ibid
What about the other side of the story – which is the big ticket item when it comes to imports of agricultural goods?
On the agri-imports front, the biggest item is edible oils — worth about $10 billion (more than 15 mt). This is where there is a need to create “aatma nirbharta”, not by levying high import duties, but by creating a competitive advantage through augmenting productivity and increasing the recovery ratio of oil from oilseeds and in case of palm oil, from fresh fruit bunches.
ibid
And within oils, Prof. Gulati recommends increasing our productivity in oil palm:
This is the only plant that can give about four tonnes of oil on a per hectare basis. India has about 2 million hectares that are suitable for oil palm cultivation — this can yield 8 mt of palm oil. But it needs a long term vision and strategy. If the Modi government wants “aatma nirbharta” in agriculture, oil palm is a crop to work on.
ibid
And on a related note, you may want to read this article from Scroll, an excerpt from which is below:
It is now clear that, in the face of rising demand, domestic production will remain way under 10% in the years to come. That essentially means that India will continue to import palm oil in various forms. However, the dynamics of imports is not just dictated by demand but also geopolitics. For instance, diplomatic tensions with Malaysia led the Indian government to discourage imports of refined palm oil from the Southeast Asian nation, resulting in a precipitous fall in recent months. Domestic palm oil processors, such as millers and refiners, also routinely demand restrictions on imports so they can protect their margins. The Solvent Extractors’ Association of India recently presented the government with a list of demands that would favour local processors. This puts further price pressures in Malaysia and Indonesia, making it more difficult to green the palm oil supply chain.
“Farmers cultivating perishable crops suffer more in times like these. The harvest is destroyed quickly due to unseasonal rains, and what survives has to be sold off without any delay. like fenugreek, that cost Rs 8, Rs 7 and Rs 13 respectively at Nashik market cost about Rs 30, Rs 15 and Rs 30 respectively at the typical vendor’s stall in Matunga. Cabbage goes up to Rs 70 per kilo from Rs 8 per kilo in a span of 300 km. Eggplant, following a similar trajectory, is pegged at Rs 80 per kilo in Mumbai, while even at Vashi, it is sold at Rs 15 per kilo.” .. .. I wish it had been written (and edited) better, but that being said, it is still an interesting, informative read about the supply chain in agriculture. .. ..
“if the Assembly had been elected on the basis of universal suffrage it would not necessarily have “possess[ed] greater wisdom…”. Indeed, “It might easily have been worse…I am quite frank enough to say that this House, such as it is, has probably a greater modicum and quantum of knowledge and information than the future Parliament is likely to have.” Despite being an ardent backer of universal franchise and (limited) reservations, Ambedkar expressed unease throughout the life of the Constituent Assembly about what would happen to the quality of the country’s democratic institutions once all Indians were allowed to participate.” .. .. This might be behind a paywall, and if so, my apologies. But even the excerpt above is worth spending some time over. Dr. Ambedkar on the Constitution of India. That is from an essay in the Caravan magazine. .. ..
I find myself unable to excerpt form this article, I am not quite sure why – but the entire thing is worth a read, particularly if you are not familiar with the politics of CAB in the North-East. .. ..
“Much of the decline in the overall LFPR is because of a steep fall in the female LFPR, from 43 per cent in 2004-05 to a pathetic 23 per cent in 2017-18. This compares poorly with female LFPRs (in 2018) of 61 per cent in China, 52 per cent in Indonesia and 36 per cent in Bangladesh. Nor can this precipitous decline in female LFPR be explained away by higher rates of female enrolment in education, since the 20 percentage point drop in LFPR is observed among both the 30+ age group (down from 46 per cent to 27 per cent) and female youth (down from 37 per cent to a heartbreakingly low 16 per cent). The current and future implications for overall female economic and social empowerment are deeply saddening.” .. .. Two articles by Shankar Acharya in the Business Standard next. One on the employment crisis in India… .. ..
“The chart shows that between 2011 and 2018, India’s goods exports increased by only 8 per cent. In sharp contrast, Vietnam’s exports grew by 154 per cent, Cambodia’s by 114 per cent, Myanmar’s by 82 per cent, Bangladesh’s by 61 per cent, the Philippines’ by 40 per cent, and China’s by 31 per cent. Rapid export growth is all about increasing market share. Between 2011 and 2018, our share of world exports stagnated at 1.7 per cent, while Vietnam’s share more than doubled, Myanmar’s increased by 80 per cent, Bangladesh’s by more than 50 per cent, the Philippines’ by 27 per cent, and even giant China’s by over 20 per cent despite trade wars. China’s share of world exports increased by 2.4 percentage points over the seven years, which is 60 per cent more than India’s total share in 2018!” .. .. And the second, in which he debunks the notion that the slowdown in India is because of the slowdown in global trade.